• About
  • Elliott Waves
    • Elliott Waves Explained
    • Elliott Wave Magic Illustrated with Wave Charts
    • Elliott Wave Edge – How Elliott Wave Traders Win
    • Fibonacci Number Series and Elliott Waves
    • How to use Fibonacci Ratio Retracements
    • Elliott Wave Books
      • The Elliott Wave Book – Five Waves to Financial Freedom
      • Dividend Growth Investing Using Elliott Waves
    • Videos
  • Equities
    • Indices
      • Africa
        • Egypt
      • Australia
      • European Indices
        • AEX – Index, Amsterdam
        • DAX Index
        • Istanbul
        • Russia
        • Spain’s IBEX 35
      • Asian Indices
        • India
        • China
        • Dubai
        • Kuwait
        • Kuala Lumpur
        • Pakistan
        • Saudi
        • Taiwan
      • US Indices
        • S&P500
        • Nasdaq
        • Dow Jones
        • Dow Jones Utilities
    • Stocks
      • Asian Stocks
        • Indian Stocks Trading
        • Dubai Stocks Outlook
        • Japanese Stocks
        • Kuwait stocks
        • Saudi Stocks Outlook
      • African Stocks
        • Egyptian Stocks
      • Swiss Stocks
      • Australian Stocks
      • European Stocks
      • US Stocks outlook
      • UK Stocks
  • Commodities
    • Copper
    • Gasoline
    • Gold
    • Natural Gas
    • Oil
    • Palm Oil
    • Raw Sugar
    • Rubber
    • Soybean Oil
    • Silver
  • Forex
    • AUD
    • Bitcoin
    • CAD
    • CHF
    • Euro
    • GBP
    • INR
    • NZD
    • JPY
  • Raves
  • Consulting
    • Consulting
  • Ramki’s Watchlist
Top News

Has Meta (Facebook) stock seen the bottom

March 21, 2022

What Is The Nearest Technical Support For Meta (NASDAQ: FB)

February 7, 2022

Using Elliott Waves to Capture a Trade in S&P500

January 27, 2022
Facebook Twitter Instagram
WaveTimes Blog WaveTimes Blog
Wave times
  • About
  • Elliott Waves
    • Elliott Waves Explained
    • Elliott Wave Magic Illustrated with Wave Charts
    • Elliott Wave Edge – How Elliott Wave Traders Win
    • Fibonacci Number Series and Elliott Waves
    • How to use Fibonacci Ratio Retracements
    • Elliott Wave Books
      • The Elliott Wave Book – Five Waves to Financial Freedom
      • Dividend Growth Investing Using Elliott Waves
    • Videos
  • Equities
    • Indices
      • Africa
        • Egypt
      • Australia
      • European Indices
        • AEX – Index, Amsterdam
        • DAX Index
        • Istanbul
        • Russia
        • Spain’s IBEX 35
      • Asian Indices
        • India
        • China
        • Dubai
        • Kuwait
        • Kuala Lumpur
        • Pakistan
        • Saudi
        • Taiwan
      • US Indices
        • S&P500
        • Nasdaq
        • Dow Jones
        • Dow Jones Utilities
    • Stocks
      • Asian Stocks
        • Indian Stocks Trading
        • Dubai Stocks Outlook
        • Japanese Stocks
        • Kuwait stocks
        • Saudi Stocks Outlook
      • African Stocks
        • Egyptian Stocks
      • Swiss Stocks
      • Australian Stocks
      • European Stocks
      • US Stocks outlook
      • UK Stocks
  • Commodities
    • Copper
    • Gasoline
    • Gold
    • Natural Gas
    • Oil
    • Palm Oil
    • Raw Sugar
    • Rubber
    • Soybean Oil
    • Silver
  • Forex
    • AUD
    • Bitcoin
    • CAD
    • CHF
    • Euro
    • GBP
    • INR
    • NZD
    • JPY
  • Raves
  • Consulting
    • Consulting
  • Ramki’s Watchlist
WaveTimes Blog WaveTimes Blog
Home » Monitoring a position after execution
Silver

Monitoring a position after execution

RamkiBy RamkiOctober 19, 201211 Comments2 Mins Read
Facebook Twitter LinkedIn Telegram Pinterest Tumblr Reddit WhatsApp Email
Share
Facebook Twitter LinkedIn Pinterest Email

As regular readers know, all wave counts are work-in-progress. I identified 32.55 as a low-risk buy in Silver before it happened with the count that an extended 5th wave was highly likely to finish there. Sure enough, we got a smart rally to 33.10. It was possible to make out that this move was made up of 5 sub waves, although it looked like a leading diagonal. As a trader, I continued to watch the position, still keeping my stop loss at 32.50. When the inevitable correction came down to the 50% retracement level followed by a smart bounce, I was all smiles. The speed of the rally from the end point of wave (2) was also perfect. But I couldn’t relax, because real money is involved. This is no arm-chair analysis. The stop loss had to be moved promptly to the low of wave (2) so that not only we preserve some profits, but also ensure we won’t get taken out by any unexpected event. As it happened, Silver came down and stopped the trade just below the wave (2) low. Then we got another rally, but there is no question of chasing it now. A trade has to work as anticipated. Any recovery after an extended fifth wave down move should be both RAPID and clean!
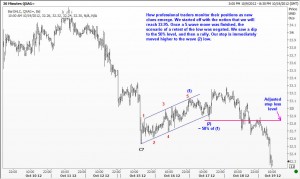
You now have an example of how one needs to monitor a trade even when it looked good. This is where a good adviser will help. I would have shared with you the need to move the stop loss to 32.80. Without that advice, you would still be thinking that everything is working out just fine. Some others might even attempt buying at 32.60 on the second attempt there, not realizing that professional traders are no longer interested in trading Silver from the long side just now. This is a terrific example for beginning traders to learn from. Nothing in the market is certain. However, we have to take risks at precise levels at the right time. Failure to act at the right time, both to enter a trade and to exit it will cause financial loss.

Silver
Share. Facebook Twitter Pinterest LinkedIn Tumblr Telegram Email
Previous ArticleElliott Wave Analysis of Silver – update
Next Article Exclusive Membership Now Open
Ramki
  • Website

Related Posts

Elliott Wave Analysis of Silver – update

October 17, 2012

Elliott Wave Comments on Silver

October 8, 2012

Elliott Wave Analysis of Silver

July 18, 2011
View 11 Comments

11 Comments

  1. Ankur Aditya on October 19, 2012 3:30 am

    Dear Sir,
    This was the thing which i wanted you to focus for ur viewers as also written in an e-mail which i sent u yesterday. This art of managing trade is more important than anything else. Technical Analysis gives u a clue to anticipate unfolded move but a trader should be able to hold his/her nerves and act sensibly if his anticipation getting wrong. Latest move of silver is a perfect example which u have demonstrated so well this is the key thing which all traders should learn from u beside Elliot wave analysis.
    Thanks for ur quick response with a practical example.

    Reply
  2. Vasilios Vasiliou on October 19, 2012 11:38 am

    Dear Ramki,
    Greek stock index climbed today at 870 points (+85% from lows). UBS, in its recent technical report, referred to Athens General Index saying that this is the top performance in Europe for 2012. Do you think is worthwhile to post a new article for our index?

    Reply
  3. peter on October 19, 2012 12:57 pm

    HI RAMKI.
    Re SIlver(QXAG)The most important empirically derived rule that can be distilled from our observations of market behavior is that when the fifth wave is an extension,the ensuing correction will find support at the level of the low of wave two of the extension.
    Regards.
    Peter.

    Reply
    • Ramki Ramakrishnan on October 20, 2012 1:02 am

      Peter, that’s correct. This was why I originally planned that trade at 32.60. But as demonstrated in the subsequent update, we have to monitor a position.

      Reply
  4. chauhan on November 3, 2012 6:55 am

    ramki sir it’s not a triangle its a turned a ABC
    and now its returned from weekly 61%, and down by 5% prise
    i dont now whats the wave counts, but mis a opportunity

    Reply
    • Ramki Ramakrishnan on November 4, 2012 8:30 pm

      Chanhan, don’t worry. The markets will always give you plenty more opportunities. Just be patient for the right setup

      Reply
  5. p kuamr on November 11, 2012 9:41 pm

    Sir, i am very new to elliot wave and often get confusion in counting the waves.
    Here, as you have shown wave 1 @ 17110 on june 18, 2012. Why it cant be 17631 on july 10, 2012. Rest every has been made easier by you in following charts.

    Thank you for great learning material

    P.Kumar

    Reply
    • Ramki Ramakrishnan on November 14, 2012 11:31 pm

      Hi Kumar, All wave counting is a work-in-progress. Use Elliott Waves to trade, rather than make predictions! As you gain more experience with the charts you will find it rewarding! Good luck.

      Reply
    • subodh narkhede on January 6, 2013 10:00 am

      Sir,
      I am purchased Five waves to financial freedom
      10 month before. But I didnot receive updated version copy of e-book

      subodh narkhede

      Reply
      • Ramki Ramakrishnan on January 6, 2013 6:02 pm

        Hi Subodh, Could you please see the link on the top right corner of the blog? Click that and follow the guidelines.

        Reply
  6. Raghu on April 3, 2013 7:28 am

    Hello sir, Please updates your views in Gold and Silver .

    Reply

Leave A Reply Cancel Reply

Recent Posts
  • Has Meta (Facebook) stock seen the bottom
  • What Is The Nearest Technical Support For Meta (NASDAQ: FB)
  • Using Elliott Waves to Capture a Trade in S&P500
  • Hedge Funds and Elliott Waves – Netflix $NFLX
  • When Elliott Waves applauds the promoter’s signals!

WaveTimes is a Research Organization dedicated to providing original analysis, reports, reviews, and insights on developments in mutual funds, stocks, investing, foreign exchange, commodities, and bonds.

Contact WaveTimes

L-601 Mantri Espana,

Kariyammana Agrahara, Bellandur, Bangalore 560103

Follow Us

  • Facebook
  • YouTube
  • Twitter

© 2023 Wave Times. All Rights Reserved.
  • About
  • Books
  • Privacy Policy
  • Policies and Standards

Type above and press Enter to search. Press Esc to cancel.