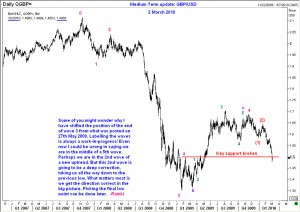
In this update, I am going to look at the medium term outlook for Sterling Pound, or GBP/USD. Those who have subscribed to this blog would have seen the last medium term update on cable, (another name for GBP/USD) posted here on 4th August 2009. (here is the link to that post). But the more important medium term update for Sterling Pound was written on 27 May 2009, and I urge you to read that post again. There two updates are pretty good examples of how one could use Elliott Wave analysis to navigate the market. They serve to highlight the fact that we first come up with the direction of the medium term move, and also a ball-park target. As the market unfolds in the anticipated direction, and approaches the said target, we look at fresh clues and adjust the original target to take account of any new information. These tweaks took place over several shorter-term updates which are also documented in this blog. All you have to do is to search under Forex and look for GBP. Over a period of time, we have gone from a monthly chart all the way down to a 10-minute chart! Elliott Wave Principle works in all time frames.
The recent insistance by Mr Mervyn King that the Bank of England cannot rule out fresh quantitative easing only confirms that there are a lot of downside risks for the UK. Clearly this is not supportive for the Sterling Pound. But let us go back to the GBP/USD charts.  As you can see here, a key support has broken decisively and we are headed towards 1.4700 as a first step. Allow for a few sessions of back-and-forth moves (part of a mini 4th wave pattern) and then fresh selling to come forth again. While we stay below 1.5250 now the Sterling Pound will remain under considerable pressure and gradually ease down to 1.4150 initially, and should the going get tougher (perhaps with a hung parliament), we can even say the original target of 1.3300 area is within reach in the coming months.

