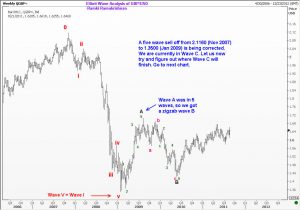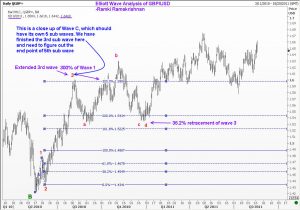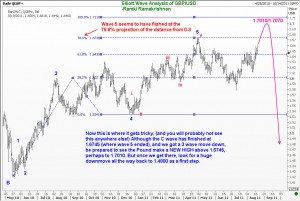

 The Medium Term Outlook for the GBP/USD using Elliott Wave analysis is best figured out by starting your query from the longer term chart. A clear five wave decline from 2007 ended in 2009. That decline is being corrected in a 3 wave pattern, ABC. We seem to be in Wave C at the moment, and it will be invaluable information to the trader/investor/corporate treasurer to know in advance where wave C might end, and what will happen then. The three charts presented here shows you the way.
I have tentatively posted my expectation for the move to finish at 1.7010/1.7070 after which we should see a huge move down, perhaps back all the way to 1.4850 area. Keep an eye on WaveTimes as we will fine tune the terminal points as we get nearer the said targets. Your immediate clue is we are going up now, perhaps to a new high for this year, but just when you think it will keep going up, things will suddenly take a turn for the worse. Be prepared!
Medium Term Outlook for Sterling Pound GBP/USD

Unleash your Potential
Transform your trading – Starting Today
