• About
  • Elliott Waves
    • Elliott Waves Explained
    • Elliott Wave Magic Illustrated with Wave Charts
    • Elliott Wave Edge – How Elliott Wave Traders Win
    • Fibonacci Number Series and Elliott Waves
    • How to use Fibonacci Ratio Retracements
    • Elliott Wave Books
      • The Elliott Wave Book – Five Waves to Financial Freedom
      • Dividend Growth Investing Using Elliott Waves
    • Videos
  • Equities
    • Indices
      • Africa
        • Egypt
      • Australia
      • European Indices
        • AEX – Index, Amsterdam
        • DAX Index
        • Istanbul
        • Russia
        • Spain’s IBEX 35
      • Asian Indices
        • India
        • China
        • Dubai
        • Kuwait
        • Kuala Lumpur
        • Pakistan
        • Saudi
        • Taiwan
      • US Indices
        • S&P500
        • Nasdaq
        • Dow Jones
        • Dow Jones Utilities
    • Stocks
      • Asian Stocks
        • Indian Stocks Trading
        • Dubai Stocks Outlook
        • Japanese Stocks
        • Kuwait stocks
        • Saudi Stocks Outlook
      • African Stocks
        • Egyptian Stocks
      • Swiss Stocks
      • Australian Stocks
      • European Stocks
      • US Stocks outlook
      • UK Stocks
  • Commodities
    • Copper
    • Gasoline
    • Gold
    • Natural Gas
    • Oil
    • Palm Oil
    • Raw Sugar
    • Rubber
    • Soybean Oil
    • Silver
  • Forex
    • AUD
    • Bitcoin
    • CAD
    • CHF
    • Euro
    • GBP
    • INR
    • NZD
    • JPY
  • Raves
  • Consulting
    • Consulting
  • Ramki’s Watchlist
Top News

Has Meta (Facebook) stock seen the bottom

March 21, 2022

What Is The Nearest Technical Support For Meta (NASDAQ: FB)

February 7, 2022

Using Elliott Waves to Capture a Trade in S&P500

January 27, 2022
Facebook Twitter Instagram
WaveTimes Blog WaveTimes Blog
Wave times
  • About
  • Elliott Waves
    • Elliott Waves Explained
    • Elliott Wave Magic Illustrated with Wave Charts
    • Elliott Wave Edge – How Elliott Wave Traders Win
    • Fibonacci Number Series and Elliott Waves
    • How to use Fibonacci Ratio Retracements
    • Elliott Wave Books
      • The Elliott Wave Book – Five Waves to Financial Freedom
      • Dividend Growth Investing Using Elliott Waves
    • Videos
  • Equities
    • Indices
      • Africa
        • Egypt
      • Australia
      • European Indices
        • AEX – Index, Amsterdam
        • DAX Index
        • Istanbul
        • Russia
        • Spain’s IBEX 35
      • Asian Indices
        • India
        • China
        • Dubai
        • Kuwait
        • Kuala Lumpur
        • Pakistan
        • Saudi
        • Taiwan
      • US Indices
        • S&P500
        • Nasdaq
        • Dow Jones
        • Dow Jones Utilities
    • Stocks
      • Asian Stocks
        • Indian Stocks Trading
        • Dubai Stocks Outlook
        • Japanese Stocks
        • Kuwait stocks
        • Saudi Stocks Outlook
      • African Stocks
        • Egyptian Stocks
      • Swiss Stocks
      • Australian Stocks
      • European Stocks
      • US Stocks outlook
      • UK Stocks
  • Commodities
    • Copper
    • Gasoline
    • Gold
    • Natural Gas
    • Oil
    • Palm Oil
    • Raw Sugar
    • Rubber
    • Soybean Oil
    • Silver
  • Forex
    • AUD
    • Bitcoin
    • CAD
    • CHF
    • Euro
    • GBP
    • INR
    • NZD
    • JPY
  • Raves
  • Consulting
    • Consulting
  • Ramki’s Watchlist
WaveTimes Blog WaveTimes Blog
Home » Medium Term outlook for GBPUSD – Sterling Pound
GBP

Medium Term outlook for GBPUSD – Sterling Pound

RamkiBy RamkiMay 10, 201237 Comments1 Min Read
Facebook Twitter LinkedIn Telegram Pinterest Tumblr Reddit WhatsApp Email
Share
Facebook Twitter LinkedIn Pinterest Email

The GBPUSD or Sterling Pound has been trading in an narrowing range since late 2008. So what is the medium term outlook for this currency pair? From an Elliott Wave perspective, we seem to be developing the ‘E’ wave within a triangle. Once this final upmove is finished, we should get ready for a significant down move in Cable, or the Sterling Pound. Now I have used a weekly chart to figure out the end of the E wave.
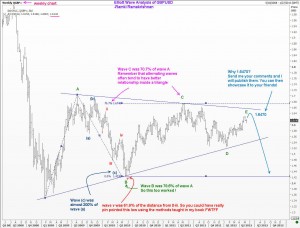
Maybe you could do better? Look at the daily chart and use the method I have taught in the book ‘Five Waves to Financial Freedom’. Send me your comments by posting on the blog and I will publish them. If you get the top right, you can showcase it to your friends. Share it with the world even if you think the Sterling Pound is going straight to the moon! After all, anyone can be wrong, and you could be right! Happy Holidays…..

cable GBP GBP/USD
Share. Facebook Twitter Pinterest LinkedIn Tumblr Telegram Email
Previous ArticleHoliday Notice
Next Article Ramki discusses elliott waves with Forbes editor John Dobosz
Ramki
  • Website

Related Posts

Irregular Correction – Example from FWTFF book

January 1, 2019

How Elliott Waves enabled us to anticipate multiple turning points in GBPUSD

August 9, 2018

Trading GBPUSD in the short term

May 1, 2013
View 37 Comments

37 Comments

  1. Antonio on May 10, 2012 2:02 am

    Hello Mr Ramki, Why 1,64 you ask… I think there is an ABC x ABC in the D-E leg, and we should be completing 4th wave of the last C leg, as you explain in your book for triangles, so the 5th would take us to around 1,637, which is 61,8% of the 0-3 distance taken from the end of wave 4. It is very amazing I was not able to do anything like this three months ago before reading your book, and now with your great help I am starting to see what all this means. Thank you again!
    Antonio

    Reply
  2. David Gotlib on May 10, 2012 4:09 am

    Hello Ramki,
    I follow the GBP and most of the FX currencies and I have the same ideia about the cable. The only difference is that for me is that the D wave of the triangle is not complete.
    The reason is that I think that the retracement is short of 61,8% of the C wave.
    Bellow is a link with my chart.
    http://dl.dropbox.com/u/6854752/Acertar%20na%20mosca/imagens/GBP%20Ramki.PNG
    I would like your comments
    Regards,
    David Gotlib

    Reply
    • Ramki on May 10, 2012 11:02 pm

      Hi David, I see your approach, but my wave D is related to wave B. In any case the more important point is we agree on the direction. As I keep saying, the goal is not so much to get the right labels, rather it is to get the trade right.good luck and thanks for writing.

      Reply
  3. Ted Noel on May 10, 2012 11:06 am

    Your number comes from extending the upper boundary of the triangle right to intersect the upsloping support line drawn across the lows of wave E. Making wave 5 of C equal to wave 3 would put the top at 1.655. If equal to .618 of 3 it would land at 1.6344. Since the top of wave 3 is at 1.63, that’s as high as C is required to go, and a short wave E would not be uncommon.

    By the way, Elliott Wave International had their wave D at 11/6/11. I argued with my coach for the same point you chose (but without knowing you picked it). Based on the appearance of the subwaves of 5 of C of E, I don’t think E will go much beyond 1.63.

    Reply
    • Ramki on May 10, 2012 11:17 pm

      Ted, thank you for posting. Btw, I visited your site, Bibleonly.org and wish to compliment you on your wonderful work.

      Reply
  4. KB on May 10, 2012 12:51 pm

    Hi Ramki, regarding the top in gbp/usd, I would say we’ve already seen it at 1.63016 on the 30/04, this is due to the completion of the double zig zag in the $dxy, lets wait and see.

    Reply
  5. Yan on May 11, 2012 2:02 pm

    Hi Sir.

    I think the E wave could end at 1.6452 or 1.6471

    on this daily chart: http://screencast.com/t/yr023OA2M

    you have Y=1.236 of W and the E wave on the larger degree equals to 50% of the C wave in the weekly triangle.

    Thanks,

    Yan

    Reply
  6. Anton Fave on May 12, 2012 1:39 am

    Dear Sir,

    I calculated Wave E as follows: Point 0 = 1,52364, Point 3 = 1,57699, Point 4 = 1,6048, Point 5 (Fibo 79%) = 1,64695

    I hope this is correct, thank you Sir, I like your book FWTFF very much,

    Toni

    Reply
  7. Chacho on May 12, 2012 3:08 am

    Is it possible that we have reached the E wave in 1.6300, as it has reached 70.7% of Wave D?
    Thanks.

    Reply
    • Ramki on May 13, 2012 1:45 pm

      hi Chacho, just about anything is possible, but generally alternate waves have better relationships

      Reply
  8. Madison on May 12, 2012 8:02 pm

    I’ll take a shot. From the start of A (1.3505) to C (1.67457) to D (1.52334), the fib extension is 38.2% or 1.6470. But I would wait and see if they run the stops on the shorts at 50%.

    Reply
  9. Dimitrios Charalampidis on May 13, 2012 10:18 am

    Hi, I also agree on the direction and counting; however I want to mention smth.
    Truncation is very common for GBP/USD and thus a very probable end of E is @1.6300, also the triangle becomes invalid only after 1.6745, where is the completion of C. Thus, all fibo retracements in-between are probable.
    Weekly:
    http://imageshack.us/photo/my-images/406/gbpusdweekly.png/
    Daily:
    http://imageshack.us/photo/my-images/23/gbpusddaily.png/

    Reply
  10. dipak on May 20, 2012 12:02 am

    Dear sir,
    can u tell me about data that used for studying Elliott waves.
    true data all of mt4 have diffenrent data so I am very
    confused about the accuracy of any one set of data will I used for
    study.

    Reply
    • Ramki on May 23, 2012 7:46 am

      Hi Dipkak, thank you for this important question. It doesn’t matter if your data is slightly different from someone else’s. Your wave count could be different from another person’s and both of you could still make money. Just be faithful to your own count.

      Reply
  11. KJ on May 22, 2012 6:59 pm

    Ramki,

    What would be your suggestions for the top three books for experienced investors who are interested in learning about Elliot Wave analysis?

    Thanks,
    KJ

    Reply
    • Ramki on May 23, 2012 7:24 am

      Hi KJ! I would suggest Robert Beckman and Robert Prechter as two good books. You can decide the third 😉

      Reply
      • JohnW on June 9, 2012 3:43 pm

        KJ, there is another Elliott Wave book which is very clear and concise. It is not hard to find either. You can use your scroll bar at the right of this window to scroll up and find an image near the top of the page which links to an ebook. It is called Five Waves to Financial Freedom. Don’t let the inexpensive price mislead you into thinking it is not worth much. 😉

        Kind regards,
        John

        Reply
  12. Luca on May 24, 2012 5:03 am

    Looking at EUUS chart “I think” this is not wave C, but still wave B.
    B has 3 waves. a of B went up to the high of 1.3486, we’re now in b of B and we had an irregular correction where b of B went below the initiating point of a of B.

    In b of B we can see a (first move down), then a 3 wave move up b, then, to complete, a move down c currently completing it’s 5th wave.

    I know this should be about GBUS, but they’re somehow related.
    What is your opinion Ramky?

    Thanx a lot.

    Reply
  13. Nouf on May 25, 2012 5:58 am

    I think the high is likely now in for GBPUSD and a 135 test is most likely going forward over the coming months/years

    I have seen enough to suspect its a high probability of the highs being in place now

    Reply
  14. al on May 31, 2012 12:06 pm

    I really appreciate your analysis Ramki;

    how far can the next corrective move go?

    Reply
    • Ramki on June 5, 2012 4:54 am

      Hello Al, thanks for the message. My recommendation would be for you to learn the craft of Elliott wave analysis so you can figure this out yourself! Good luck.

      Reply
  15. Steve on June 4, 2012 11:07 pm

    Hi Ramki
    I trust you have had a relaxing family holiday.

    Having purchased your book, and read it 3 times, I find it fantastic reading, simple and concise. Thank you for it.

    Please tell me – you mention ‘reflex point’ in the book and in your posts.

    How does one calculate the ‘reflex point’?

    Many thanks for your help.

    Reply
    • Ramki on June 5, 2012 5:01 am

      Hi Steve, thanks for the comment. There isn’t any calculation. It is usually the minor fourth wave in the immediately preceding impulse wave.

      Reply
  16. JohnW on June 9, 2012 5:24 pm

    Hello Mr. Ramki,

    I greatly appreciate your clear analysis and your book.

    My first target for wave E would be about .5 of the length of wave C, (wave C length=.2510 X .5 = .1255). A .5 retracement seems best here because we have already passed .382 of wave C’s length, and .618 of wave C would put the price outside of the trend line. But my calculator says that would take wave E to 1.6489, which is a little further than your estimate.

    You looked both relaxed and rested in the Forbes video; I hope you enjoyed your time off and I hope your family is well. Congratulations on your daughter’s graduation (Forbes’ website mentioned this).

    I will be watching GBPUSD closely over the next few days and weeks. Waves A through D all lasted about 7-12 months, and triangles seem to go on longer than I expect, so I thought wave E was still unfolding. But the 5-wave move down since April 29th suggests we may be breaking out of the triangle, mostly because I can’t label this move as a wave b of E. I don’t think b waves can move in 5 waves, correct?

    Either way, it seems to set up a low risk, high reward trade, and I’ll let the market tell me which is right.

    Kind regards,
    John

    Reply
    • Ramki on June 10, 2012 10:10 pm

      Hello JohnW, Many thanks for your kind words. You are right in saying ‘b’ waves cannot be made up of five waves. Also, you are on the right track when you realize that at any point in time there could be multiple counts possible for an unfolding movement, and so long as one sticks to ONE count until that is proved wrong, he/she will usually make money (or at worst, keep the losses very small). Good luck.

      Reply
  17. lilly on September 13, 2012 11:55 am

    hello,ramki.
    thank you for your analysis.it is very useful for my learning EWP!

    Now,GBP/USD is going up to the level of previous high,
    So I am thinking this is “E” wave.
    If it is right, this pair will leach 1.64 level (as you said)
    then down trend will start…

    By the way, I have a question.
    is the diagonal formation “leading diagonal”?
    (3-5-3-5-3)

    Reply
    • Ramki Ramakrishnan on September 14, 2012 12:04 am

      Hi Lilly, A leading diagonal will have a 5-3-5-3-5 set up. This has been covered in FWTFF. Good luck

      Reply
      • lilly on September 14, 2012 2:05 am

        woops,
        thankyou for your reply…

        I’m going to read your books again and again!

        Reply
      • Ajoy on September 14, 2012 5:29 am

        Ramki,

        Then GBPUSd could be on Wave E with 5 wave structure.

        If Wave 3 in Wave E ends at 1.63194 then we have Wave 4 in Wave E after leading triangle at .381 of Wave 3(1.5963). Then Wave 5 in Wave E at 1.6470/1.653. Then as you said the trend should towards 1.35 start.

        since Wave 1, Wave 2 took more than 2 months. Wave 4 and Wave 5 could be over in couple of weeks time.

        So shall I wait till end of Wave E? I want to build up the lost capital . Ramki, where should I make a Low risk High profit support point?
        I need your advice.

        Reply
  18. Ajoy on September 13, 2012 11:07 pm

    Ramki,

    Looks like Cable thrust target is heading to your count.

    GBPUSD never went below D 1.5236.

    Reply
  19. Ajoy on February 12, 2013 1:06 pm

    Ramki,

    As mentioned in your book FWTFF, if wave 2 barely completes 50% of wave 1 and wave 3 has completed 1.382 (wave 1) and wave 4 completes .382(wave 3) , then we can expect an extended wave 5 (wave 1 ~ wave 3) . GBP/USD just on track to confirm your theory. Do you agree? If so, good trading in GBP/USD expected 600 pip average. Looking for RSI confirmation.
    Regards,
    Ajoy

    Reply
    • Ramki Ramakrishnan on February 17, 2013 6:26 pm

      Ajoy, sorry I just saw your comment. Wll take a look tomorrow to see what happened and update this response.

      Reply
      • Ajoy on February 20, 2013 12:45 pm

        Ramki,

        By the time you respond, the trade is nearly over.

        Regards,

        Ajoy

        Reply
        • Ramki Ramakrishnan on February 24, 2013 10:56 am

          Ajoy, That is indeed true. WaveTimes is not there to give timely trading advice. This is where people come to learn.

          Reply
          • Ajoy on February 24, 2013 4:26 pm

            Well,
            Thanks to you and FWTFF, By God’s grace, I am on my way to my FWTFF. Keep posting….

            Pst… Pst …Pst : at least a hint as to what to expect in GBP/USD

  20. Ajoy on February 18, 2013 6:31 am

    Ramki,
    Simultaneously Eur/USD is also heading for 800 pip dive.

    Regards,

    Ajoy

    Reply
  21. Andras on February 18, 2013 4:46 pm

    Hi,
    I think from this area (1.54-55) because we have a clear five wave from 1.6380 this is an excellent opportunity to catch a minimum 3 wave correction to upside with 1.6000 target.
    thank you

    Reply

Leave A Reply Cancel Reply

Recent Posts
  • Has Meta (Facebook) stock seen the bottom
  • What Is The Nearest Technical Support For Meta (NASDAQ: FB)
  • Using Elliott Waves to Capture a Trade in S&P500
  • Hedge Funds and Elliott Waves – Netflix $NFLX
  • When Elliott Waves applauds the promoter’s signals!

WaveTimes is a Research Organization dedicated to providing original analysis, reports, reviews, and insights on developments in mutual funds, stocks, investing, foreign exchange, commodities, and bonds.

Contact WaveTimes

L-601 Mantri Espana,

Kariyammana Agrahara, Bellandur, Bangalore 560103

Follow Us

  • Facebook
  • YouTube
  • Twitter

© 2023 Wave Times. All Rights Reserved.
  • About
  • Books
  • Privacy Policy
  • Policies and Standards

Type above and press Enter to search. Press Esc to cancel.