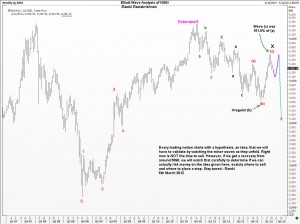
The Indian stock market rally in 2012 caught many players by surprise. Towards the end of last year, India ranked as one of the worst performers in Asia, but in a few short weeks, everything had changed. The rally in NSE India from the 4531 low has already covered 61.8% of the prior decline. But there are many questions about the fundamental reasons for this upmove.

Elliott Wave analysis is a powerful and flexible tool. We can use Elliott Waves to determine where in the big picture the Indian stock index is currently positioned. Remember that when we first do the analysis of the big picture, it is hypothetical. No one knows for sure what will happen in the future, but we use our best judgment to prepare a hypothesis. After that we start watching the minor moves to see if the market is actually confirming our hypothesis. At some point in time, it will become evident whether or not we are on the right track. Finally, when we gain suffcient confidence about the whole plan, we should move in confidently. Until that moment arrives we should be patient, but alert! The best traders know how to hold back until the most opportune moment. Then they move in aggresively. They will no longer doubt themselves. They know their risk is limited to something affordable, and they also know that unless one takes a risk, there is no reward. These are the principles I have explained in my book “Five Waves to Financial Freedom”.
Looks like Indian stock market rally is fading: NSE India

Unleash your Potential
Transform your trading – Starting Today
