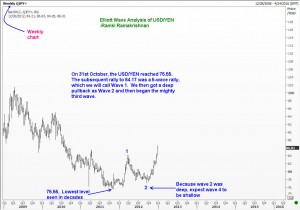
I have often stated in this blog that we should use Elliott Wave Analysis to aid us in our trading decisions. Some people mistakenly believe that the goal of Wave Analysis is to make accurate predictions, and spend a great deal of time verifying i ftheir count is correct. I am also aware that some analysts showcase their wave-counting skills when things go right. Wave Times is different. I would like you to see how my wave count in USD/YEN was actually wrong, but the direction was right. I have no hesitation is accepting that my counts are often wrong, although it will become evident only with hind sight. My approach to the market is to use this invaluable tool in making the right trading decisions. Start by looking at my Elliott Wave update of 23 July 2012. (An easy way to get there is by looking at the menu, under Forex, and choosing JPY). In that update, I has suggested to sell the USD on any recovery for a move down to 77.20 and eventually down to 76.70. The USDYEN went up to 79.66 on 20 August and then came down to a low of 77.11. Note two things here. (a) it did not reach 76.70 and (b) in that update I had counted the waves as a 5-wave downmove. Both are wrong. But did it matter to the trader? Of course not. He/she knew that 77.20 was a good level, and some action needed to take place there. In today’s new update, I present you with an altogether new wave count of USDYEN.
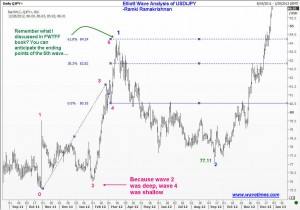
You can see that I am now calling the 77.11 low as the wave 2 low. As you know, corrections can never be in 5 waves, so my July wave count was wrong 🙂 The next chart shows you how you could have figured out where the first wave up would end.
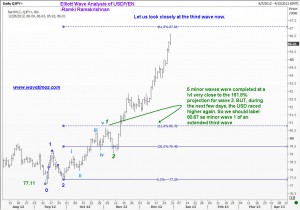
In the third chart, you can see how I am breaking down the third wave into its components. I am also pointing out how I decided that we are in an extending third wave. This is a delicate point that you should take time to understand. Supposing I had labelled the green wave 1 as the 3rd wave, then the subsequent decline would have overlapped the top of Blue wave 1. That would have made me bearish if I was only looking at wave counts. But I would have been hesitant to buy after that. But the sharp recover that followed left me in no doubt that an extension was beginning. I had actually called up my clients and told then that we are now entering a huge bull run in the USDYEN, and importers from Japan should now be patient as the Yen was going to weaken significantly. If you had read my book “Five Waves to Financial Freedom” I have covered this phenomenon. If you have a short wave 3 and an overlap followed by a sharp rally to a new high, get ready for an extended third wave!!
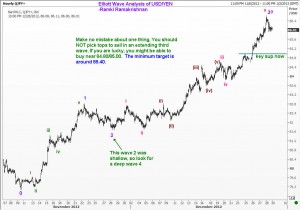
The final chart is a close up view of the extending third wave. I am looking for a move to 88.40 at least, but the path to that could invove a pull back. Don’t sell to capture this correction. Instead, be alert to buy at a good support. Around 84.80-85.00 is decent initial support. As always you need to have stops on any position, but if you get stopped, be willing to jump back into the bull camp the moment it starts steadying and moving up again. I wish you the best of luck. (By the way, I am going to be in India to conduct a private seminar in the third week of January. Just thought will let you know) -Ramki (PS I posted this via email, after testing it out last week! Not sure if the formatting will appear correctly though…so please bear with me)


