I had prepared the following article for publication in Seeking Alpha on Sunday, but I decided to share it here with you folks directly. Meanwhile Chevron Corp is already moving nicely.
Chevron Corporation is an integrated energy company with operations in countries located around the world. The company produces and transports crude oil and natural gas. Chevron also refines, markets, and distributes fuels as well as is involved in chemical operations, mining operations, power generation and energy services.
Let me be honest about one thing upfront. I don’t have a Dividend Growth Portfolio at the time of writing this article. I have been involved with the financial markets for over 30 years, and have always been in the thick of action in a variety of markets. But I neglected building a DGP. Yes, it is a serious lapse! But it is never too late to start. The goal is to reach an yield to cost of 10% within 10 years. Perhaps, Elliott Wave Analysis would help me reach that goal in a shorter time frame!
The stock had a closing price of $112.05 on Friday, 7th February 2014. If I were to buy this on Monday at $112, my own yield will be 3.59% which looks good. My Bloomberg screen shows that the 5-year Net Growth rate for dividends is 9.04% and the 3 year and 1 year dividend growth rates are respectively 11.15% and 11.11%. The P/E for the stock is 10.09. As many fundamental analysts have done adequate research on Chevron Corp and awarded it high marks, all I wanted to know before I placed my buy order was whether Elliott Wave Analysis offered me some additional clues. Is it time to add Chevron Corp to my brand new Dividend Growth Portfolio?
Let me give you a quick summary about Elliott Wave Principle. The theory was put forward by Ralph Nelson Elliott in the 1930s and has stood the test of time. Elliott discovered that all market moves in the direction of the main trend developed in a five wave pattern. Two of these five waves served to correct the first and third waves. But once the fifth wave completed, the next correction served to correct not only the fifth wave, but also the entire sequence for five waves. Hence that correction is usually bigger and lasts longer than the two minor corrections seen on the way up.
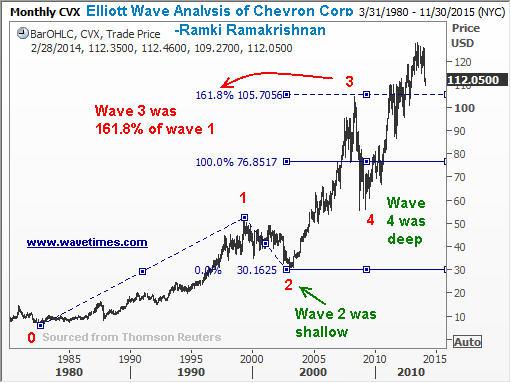
With that introduction, let us take a look at the first chart below. You can see that starting from the significant low posted in the early 1980s, Chevron Corp has a clear five wave move to its recent top. The third wave traveled a distance of 161.8% of the first wave, a classic measure for third wave moves. Some of you might recognize this ratio as a Fibonacci number. You will also notice that wave 4 and wave 2 were alternating in length and complexity. This too is as per Elliott Wave Principle.
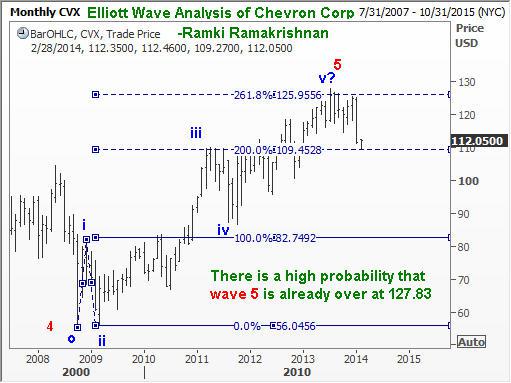
I then zoomed in to view the fifth wave to see if that had its own five minor waves. And sure enough, I could make out a clear five wave pattern there too.
So does this mean we will now experience a decline that will be longer than wave 4 seen during the great recession of 2008? If that happens, won’t the price go down to around $79?
This is where one more important guideline from the Wave Principle will help us decide. According to the theory, we should expect at least one of the three impulse waves to extend, i.e. travel an unusually long distance. From the above two charts, it is evident that both waves 1 and 3 were of ‘normal’ proportions. Hence, it is likely that wave 5 will be extended. That means what we have seen in the second chart above is not the end of wave 5, but probably only the first sub-wave within an extended fifth wave. Seen from that angle, it would be very tempting for the investor who seeks dividend income to get a full exposure of his/her maximum position size that the portfolio would allow. It is true that we could still get a dip under $100, but that dip should be used to add some more exposure to CVX. I am going to buy my first lot on Monday, before the stock goes Ex-Dividend.
