• About
  • Elliott Waves
    • Elliott Waves Explained
    • Elliott Wave Magic Illustrated with Wave Charts
    • Elliott Wave Edge – How Elliott Wave Traders Win
    • Fibonacci Number Series and Elliott Waves
    • How to use Fibonacci Ratio Retracements
    • Elliott Wave Books
      • The Elliott Wave Book – Five Waves to Financial Freedom
      • Dividend Growth Investing Using Elliott Waves
    • Videos
  • Equities
    • Indices
      • Africa
        • Egypt
      • Australia
      • European Indices
        • AEX – Index, Amsterdam
        • DAX Index
        • Istanbul
        • Russia
        • Spain’s IBEX 35
      • Asian Indices
        • India
        • China
        • Dubai
        • Kuwait
        • Kuala Lumpur
        • Pakistan
        • Saudi
        • Taiwan
      • US Indices
        • S&P500
        • Nasdaq
        • Dow Jones
        • Dow Jones Utilities
    • Stocks
      • Asian Stocks
        • Indian Stocks Trading
        • Dubai Stocks Outlook
        • Japanese Stocks
        • Kuwait stocks
        • Saudi Stocks Outlook
      • African Stocks
        • Egyptian Stocks
      • Swiss Stocks
      • Australian Stocks
      • European Stocks
      • US Stocks outlook
      • UK Stocks
  • Commodities
    • Copper
    • Gasoline
    • Gold
    • Natural Gas
    • Oil
    • Palm Oil
    • Raw Sugar
    • Rubber
    • Soybean Oil
    • Silver
  • Forex
    • AUD
    • Bitcoin
    • CAD
    • CHF
    • Euro
    • GBP
    • INR
    • NZD
    • JPY
  • Raves
  • Consulting
    • Consulting
  • Ramki’s Watchlist
Top News

Has Meta (Facebook) stock seen the bottom

March 21, 2022

What Is The Nearest Technical Support For Meta (NASDAQ: FB)

February 7, 2022

Using Elliott Waves to Capture a Trade in S&P500

January 27, 2022
Facebook Twitter Instagram
WaveTimes Blog WaveTimes Blog
Wave times
  • About
  • Elliott Waves
    • Elliott Waves Explained
    • Elliott Wave Magic Illustrated with Wave Charts
    • Elliott Wave Edge – How Elliott Wave Traders Win
    • Fibonacci Number Series and Elliott Waves
    • How to use Fibonacci Ratio Retracements
    • Elliott Wave Books
      • The Elliott Wave Book – Five Waves to Financial Freedom
      • Dividend Growth Investing Using Elliott Waves
    • Videos
  • Equities
    • Indices
      • Africa
        • Egypt
      • Australia
      • European Indices
        • AEX – Index, Amsterdam
        • DAX Index
        • Istanbul
        • Russia
        • Spain’s IBEX 35
      • Asian Indices
        • India
        • China
        • Dubai
        • Kuwait
        • Kuala Lumpur
        • Pakistan
        • Saudi
        • Taiwan
      • US Indices
        • S&P500
        • Nasdaq
        • Dow Jones
        • Dow Jones Utilities
    • Stocks
      • Asian Stocks
        • Indian Stocks Trading
        • Dubai Stocks Outlook
        • Japanese Stocks
        • Kuwait stocks
        • Saudi Stocks Outlook
      • African Stocks
        • Egyptian Stocks
      • Swiss Stocks
      • Australian Stocks
      • European Stocks
      • US Stocks outlook
      • UK Stocks
  • Commodities
    • Copper
    • Gasoline
    • Gold
    • Natural Gas
    • Oil
    • Palm Oil
    • Raw Sugar
    • Rubber
    • Soybean Oil
    • Silver
  • Forex
    • AUD
    • Bitcoin
    • CAD
    • CHF
    • Euro
    • GBP
    • INR
    • NZD
    • JPY
  • Raves
  • Consulting
    • Consulting
  • Ramki’s Watchlist
WaveTimes Blog WaveTimes Blog
Home » Is Google in Wave 5?
US Stocks outlook

Is Google in Wave 5?

RamkiBy RamkiNovember 17, 20084 Comments2 Mins Read
Facebook Twitter LinkedIn Telegram Pinterest Tumblr Reddit WhatsApp Email
Share
Facebook Twitter LinkedIn Pinterest Email

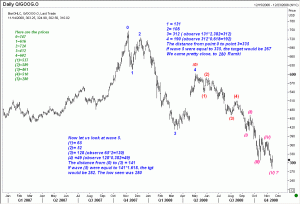
The objective of every investor is to buy as early as possible at the beginning of every new, major up move. Establishing a target for Wave 5, then, is the most important aspect of Elliot’s Wave Principle. I have presented you with a chart of Google (Nasdaq:GOOG) Let me state at the outset that there are some major objections to the way I have labelled the chart. Instead of a 5-wave pattern, one could actually label this as a zig-zag correction. But either way, the 5-wave pattern from the top of 602 is in its final leg (or possibly already finished at 280). Once we agree on that, we have a frame of reference. After every 5-wave move, a correction has to take place, and because the 5th wave of the move from 602 has been an extension, we should see a move back to 452 in the coming weeks. Please make a note of the level somewhere, and the date and level when I am making this call. The pre-market level for Google today 17th Nov 2008 is 306. If this analysis is correct, we should be looking for a 47% move up in Google over the next few months. Since we are looking for a move of $146, we need to decide how much we can risk losing on any position. This is a personal decision for each investor. However, as a starting point, we should be willing to see a retest of 280 and potentially a move down to 267. Buying below 290 would be a low risk trade, in my opinion. However, how much to buy will depend on your own risk appetite. Let me know if you have any questions. Your best way to reach me will be via the comments. Good trading!

Low risk trade idea market bottom Nasdaq stock trading stock market
Share. Facebook Twitter Pinterest LinkedIn Tumblr Telegram Email
Previous ArticleShould we exit Citi?
Next Article Yet another look at Citi
Ramki
  • Website

Related Posts

Has Meta (Facebook) stock seen the bottom

March 21, 2022

What Is The Nearest Technical Support For Meta (NASDAQ: FB)

February 7, 2022

Hedge Funds and Elliott Waves – Netflix $NFLX

January 17, 2022
View 4 Comments

4 Comments

  1. EZ on November 17, 2008 6:59 pm

    Thanks for your analysis, Ramki. I’m holding GOOG at $340, also waiting to buy below 290/280 if I get the chance. Otherwise I will be holding it for awhile. Very Helpful…thanks again.

    Reply
  2. David on November 18, 2008 3:34 am

    Thank you for taking the time . To answer your question I dont know but your post will be the source of study.

    Reply
  3. Ramki on March 2, 2009 8:25 pm

    I saw that the post “The Intelligent Investor” had picked up the 17 Nov post “Is Google in Wave 5?” as a related post. (don’t ask me why it did this!) Anyway, I ckecked out how GOOG had behaved after that post, where I looked for a potential low at 267 followed by a 47% recovery. The actual low was seen on 21 Nov at 247.30, and on 9 Feb we saw a high of 381, which is a 42% move from 267. Not bad. Unfortunately, like most of you, I did not put my money on GOOG because I was already exposed to some other markets. Sigh!

    Reply
  4. Pingback: Google Facing Big-Time Elliott Wave Wipeout - Forbes

Leave A Reply Cancel Reply

Recent Posts
  • Has Meta (Facebook) stock seen the bottom
  • What Is The Nearest Technical Support For Meta (NASDAQ: FB)
  • Using Elliott Waves to Capture a Trade in S&P500
  • Hedge Funds and Elliott Waves – Netflix $NFLX
  • When Elliott Waves applauds the promoter’s signals!

WaveTimes is a Research Organization dedicated to providing original analysis, reports, reviews, and insights on developments in mutual funds, stocks, investing, foreign exchange, commodities, and bonds.

Contact WaveTimes

L-601 Mantri Espana,

Kariyammana Agrahara, Bellandur, Bangalore 560103

Follow Us

  • Facebook
  • YouTube
  • Twitter

© 2023 Wave Times. All Rights Reserved.
  • About
  • Books
  • Privacy Policy
  • Policies and Standards

Type above and press Enter to search. Press Esc to cancel.