• About
  • Elliott Waves
    • Elliott Waves Explained
    • Elliott Wave Magic Illustrated with Wave Charts
    • Elliott Wave Edge – How Elliott Wave Traders Win
    • Fibonacci Number Series and Elliott Waves
    • How to use Fibonacci Ratio Retracements
    • Elliott Wave Books
      • The Elliott Wave Book – Five Waves to Financial Freedom
      • Dividend Growth Investing Using Elliott Waves
    • Videos
  • Equities
    • Indices
      • Africa
        • Egypt
      • Australia
      • European Indices
        • AEX – Index, Amsterdam
        • DAX Index
        • Istanbul
        • Russia
        • Spain’s IBEX 35
      • Asian Indices
        • India
        • China
        • Dubai
        • Kuwait
        • Kuala Lumpur
        • Pakistan
        • Saudi
        • Taiwan
      • US Indices
        • S&P500
        • Nasdaq
        • Dow Jones
        • Dow Jones Utilities
    • Stocks
      • Asian Stocks
        • Indian Stocks Trading
        • Dubai Stocks Outlook
        • Japanese Stocks
        • Kuwait stocks
        • Saudi Stocks Outlook
      • African Stocks
        • Egyptian Stocks
      • Swiss Stocks
      • Australian Stocks
      • European Stocks
      • US Stocks outlook
      • UK Stocks
  • Commodities
    • Copper
    • Gasoline
    • Gold
    • Natural Gas
    • Oil
    • Palm Oil
    • Raw Sugar
    • Rubber
    • Soybean Oil
    • Silver
  • Forex
    • AUD
    • Bitcoin
    • CAD
    • CHF
    • Euro
    • GBP
    • INR
    • NZD
    • JPY
  • Raves
  • Consulting
    • Consulting
  • Ramki’s Watchlist
Top News

Has Meta (Facebook) stock seen the bottom

March 21, 2022

What Is The Nearest Technical Support For Meta (NASDAQ: FB)

February 7, 2022

Using Elliott Waves to Capture a Trade in S&P500

January 27, 2022
Facebook Twitter Instagram
WaveTimes Blog WaveTimes Blog
Wave times
  • About
  • Elliott Waves
    • Elliott Waves Explained
    • Elliott Wave Magic Illustrated with Wave Charts
    • Elliott Wave Edge – How Elliott Wave Traders Win
    • Fibonacci Number Series and Elliott Waves
    • How to use Fibonacci Ratio Retracements
    • Elliott Wave Books
      • The Elliott Wave Book – Five Waves to Financial Freedom
      • Dividend Growth Investing Using Elliott Waves
    • Videos
  • Equities
    • Indices
      • Africa
        • Egypt
      • Australia
      • European Indices
        • AEX – Index, Amsterdam
        • DAX Index
        • Istanbul
        • Russia
        • Spain’s IBEX 35
      • Asian Indices
        • India
        • China
        • Dubai
        • Kuwait
        • Kuala Lumpur
        • Pakistan
        • Saudi
        • Taiwan
      • US Indices
        • S&P500
        • Nasdaq
        • Dow Jones
        • Dow Jones Utilities
    • Stocks
      • Asian Stocks
        • Indian Stocks Trading
        • Dubai Stocks Outlook
        • Japanese Stocks
        • Kuwait stocks
        • Saudi Stocks Outlook
      • African Stocks
        • Egyptian Stocks
      • Swiss Stocks
      • Australian Stocks
      • European Stocks
      • US Stocks outlook
      • UK Stocks
  • Commodities
    • Copper
    • Gasoline
    • Gold
    • Natural Gas
    • Oil
    • Palm Oil
    • Raw Sugar
    • Rubber
    • Soybean Oil
    • Silver
  • Forex
    • AUD
    • Bitcoin
    • CAD
    • CHF
    • Euro
    • GBP
    • INR
    • NZD
    • JPY
  • Raves
  • Consulting
    • Consulting
  • Ramki’s Watchlist
WaveTimes Blog WaveTimes Blog
Home » Is Bank of America a long-term buy?
US Stocks outlook

Is Bank of America a long-term buy?

RamkiBy RamkiApril 30, 201216 Comments3 Mins Read
Facebook Twitter LinkedIn Telegram Pinterest Tumblr Reddit WhatsApp Email
Share
Facebook Twitter LinkedIn Pinterest Email

Is Bank of America (NYSE: BAC) a long-term buy? Let us consider this question from an Elliott Wave point of view. We start the analysis with a weekly chart of BAC.
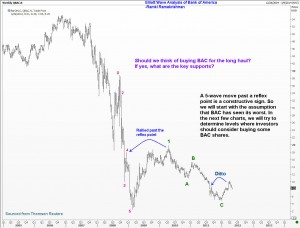
You can observe the prior steep sell off has finished with a five wave downmove, and importantly the recovery from the lows has passed the reflex point at the fourth wave position of the last impulse wave down. Wave theory suggests that when a minor five wave rally exceeds a reflex point, we should get ready to buy on a pull back. There is a mild element of doubt whether this first rally from the lows is made up of five waves, but we will give ourselves the benefit of doubt.

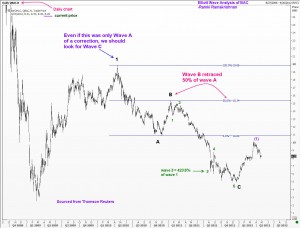
The next chart is a daily chart of Bank of America, and it shows you how the correction has developed in a three wave pattern. The “B” wave retraced by 50% before the “C” wave unfolded in five minor waves. This is all clearly marked out for you in the second chart.
The next chart zooms into the fresh five wave rally that started from the lows. As you can see, the third wave was an extended wave, travelling 423.6% of the first wave.You will also see the guideline concerning alternation coming into play, wherein the fourth wave became a complex correction after the second wave was a simple correction.
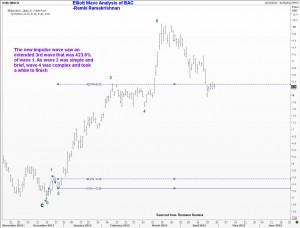
You already know from the first chart that this fresh 5-wave rally has crossed the reflex point of the C wave down. That is an added argument in favor of being positive about Bank of America stock.
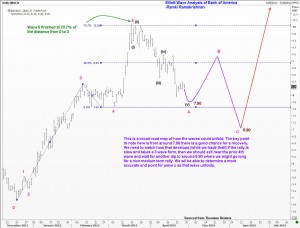
The last chart I present you today shows the correction following the completion of the five wave run up is probably nearing the completion of an “A” wave. The possible end point for the correction is around 7.90. One could consider buying in stages from there, strating off with a small amount to test the waters. We should keep adding as the market moves in our favor. The target will be at a minimum the prior 4th wave of this “A” wave. If my current interpretation is correct, we will get a C wave down, so we have to really watch the speed of the recovery from 7.90 and the structure of the rally to determine when and where we should exit. If things work out as outlined, we will be able to rebuy BAC at lower levels, but let us cross that bridge when we reach it. Good luck. By the way, I will be away on a month-long vacation starting 10th May. I will try and post a couple of updates before that. I know many of you have requested posts on a variety of instruments. I will try and do at least some of them. Take care.

BAC Bank of America correction wave
Share. Facebook Twitter Pinterest LinkedIn Tumblr Telegram Email
Previous ArticleBe Prepared for a wild ride in Caterpillar
Next Article Elliott Wave Analysis of Emar, Dubai
Ramki
  • Website

Related Posts

Has Meta (Facebook) stock seen the bottom

March 21, 2022

What Is The Nearest Technical Support For Meta (NASDAQ: FB)

February 7, 2022

Hedge Funds and Elliott Waves – Netflix $NFLX

January 17, 2022
View 16 Comments

16 Comments

  1. Dr Sanjay Pote on April 30, 2012 5:49 pm

    Dear Ramki Sir, kindly post your analysis on NSE Nifty before going on the vacation.
    Thanks in advance. Wishing you happy vacation.
    Regards,

    Reply
  2. John Tortolano on April 30, 2012 12:18 pm

    Ramki,
    I have read your book and refer to it almost every day. Just a wonderful book, thank you for sharing. Elliot claimed to use hourly charts at the close. Do you do the same?
    Also, where do you get the hourly charts that go back in time further than five days?

    Reply
    • Ramki on April 30, 2012 8:04 pm

      Hi John, thanks for the comments. Intraday data is always limited in time. I don’t know where you can get free data beyond 5 days, as I have been using Reuters professional. But I usually find that the dily charts give better signals

      Reply
  3. Antonio on May 1, 2012 3:24 pm

    Hi Mr Ramki, Thank you for your master class about this stock! I have been wondering why did you labeled as IV wave the first move up to 9,17 and not the second one in the last chart… May be because of the personality of the second one, which seems to be not so steep?
    I wish you very happy holidays, we´ll miss you this next month,
    Antonio

    Reply
    • Ramki on May 1, 2012 10:01 pm

      Hi Antonio, thank you. If you have read my book you will know by now that all wave counts are at best tentative in nature. We have to take a stance, and follow up with it, and know when that stance is wrong. I chose the first move to label as (iv) because the second one did not exceed that level, and so (for the present) could be counted as wave 2 of the currently-in-progress wave (v)!

      Reply
  4. Karuna Kanagaratnam on May 18, 2012 7:57 am

    Ramki,

    It seems to me that wave 5 extended down to 6.91 today without the abc waves. How do you see this playing out. Also, I noticed that CAT didn’t bounce back to 98 either.

    I would like to hear your thoughts.

    Safe travels.

    Karuna

    Reply
    • Ramki on May 19, 2012 2:52 am

      Hi karuna, sorry I dont hv access to my charts. Remember that wavetimes is trying to help you “think” like an Elliott wave analyst. Trading the market requires fine tuning as the waves unfold

      Reply
  5. Karuna Kanagaratnam on May 21, 2012 9:30 am

    Ramki,

    My questions reflect the recent unfolding. I wanted to see if my interpretations match up with yours.

    Thanks.

    Karuna

    Reply
    • Ramki on May 23, 2012 7:48 am

      Hi karuna. Sorry I am still traveling.

      Reply
  6. ron on June 6, 2012 10:47 am

    I am new to Elliott Wave. Hard time with corrective count complexities. If your book explains how to count with the clarity of your text above, pls tell me how to acquire one. Thanks.

    Reply
    • Ramki on June 6, 2012 7:50 pm

      Hi Ron, thanks for writing. A lot of people seem to like my book because of its easy style. You will find the links under the section for “books” on top of the blog. Welcome aboard.

      Reply
  7. David Gotlib on June 14, 2012 12:17 pm

    Hello Ramki,
    You enjoyed your vacation?
    I bought BA around U$ 7,90 and after that, the stock went down till U$6,72 close to 61,8% retracement from the supposed wave 1( wave A). Since them it recoverd a little and now it’s trading at U$ 7,65. My doubt is : a) Are we in the B wave or a new low is expected to complete wave A.
    Regards,
    David

    Reply
    • Ramki on June 15, 2012 2:01 am

      Hi David, Thanks for writing. As you know, I am currently not offering trading advice. However, you need some guidance in this stock. The recovery from 7.90 was not sharp. Remember from my book that the personality of a third wave should be different? That should have served as a warning that we will probably go directly to 6.90. As you pointed out, it went lower, to 6.72. the good news is the daily charts are still positive and you will likely be able to lighten the position near break even. However,my medium term outlook for the overall market is not so positive which means for BAC to embark on its long term rally it will take time. There is no change to my beliefs that BAC is good for the long term investor. Indeed we should build into this stock at various levels. Just don’t expose your full amount at the 7.90 levels. Good luck.

      Reply
  8. Joe on August 11, 2012 2:28 am

    Hi Rami,

    In your book, you gave an example on the hourly NZD that trends in an “unexpected” complexity in the B wave. I am now staring on the daily BAC chart and notice that it is also currently in the complex B wave, now in the second zigzag phase. This suggests to me that the “imminent” (hopefully) C wave is going to be steep and the drop is going to be at least the length of wave A. Therefore, there exists a possibility that the end of wave C may be lower than the low made in Jan 09. Does that mean that there will be a need to re-do the wave count ?

    regards,

    Reply
    • Ramki Ramakrishnan on August 11, 2012 11:15 pm

      HI Joe, For the time being, I will continue to hold the view that the 2009 low is the significant one, and that we made a new 5 wave start to a bull phase since then. What we are seeing now is the second wave doing its complex thingy.Perhaps teh 2nd wave will see its C wave take it down towards the prior lows, and it is not essential for wave C to equal Wave A (refer to my book Five Waves to Financial Freedom for details)

      Reply
  9. Robert Dreslinski on March 19, 2013 5:18 am

    Dear Ramki……One has to marvel at your ability to model an investment strategy using the EW analysis as a tool. I have watched many of your futuristic plans unfold just as you have predicted. BAC is up 83% (in less than a year) from the $6.90 benchmark you suggested in April 2012. Curious that most hedge funds and mutual fund managers have trouble beating the averages, let alone a near doubling in value…in less than one year. During the time I have watched and learned, I have also seen you identify those “ideas” which didn’t work (not many mind you) in the fashion of a true “honest man.” Proves only one thing though – you are human. All who have read your book and have an active account are fortunate to know you. The old adage is “fortune favors the brave”…therefore, you must have the heart of lion. Good fortune to you dear Ramki, and all those that have learned from you.

    Reply

Leave A Reply Cancel Reply

Recent Posts
  • Has Meta (Facebook) stock seen the bottom
  • What Is The Nearest Technical Support For Meta (NASDAQ: FB)
  • Using Elliott Waves to Capture a Trade in S&P500
  • Hedge Funds and Elliott Waves – Netflix $NFLX
  • When Elliott Waves applauds the promoter’s signals!

WaveTimes is a Research Organization dedicated to providing original analysis, reports, reviews, and insights on developments in mutual funds, stocks, investing, foreign exchange, commodities, and bonds.

Contact WaveTimes

L-601 Mantri Espana,

Kariyammana Agrahara, Bellandur, Bangalore 560103

Follow Us

  • Facebook
  • YouTube
  • Twitter

© 2023 Wave Times. All Rights Reserved.
  • About
  • Books
  • Privacy Policy
  • Policies and Standards

Type above and press Enter to search. Press Esc to cancel.