• About
  • Elliott Waves
    • Elliott Waves Explained
    • Elliott Wave Magic Illustrated with Wave Charts
    • Elliott Wave Edge – How Elliott Wave Traders Win
    • Fibonacci Number Series and Elliott Waves
    • How to use Fibonacci Ratio Retracements
    • Elliott Wave Books
      • The Elliott Wave Book – Five Waves to Financial Freedom
      • Dividend Growth Investing Using Elliott Waves
    • Videos
  • Equities
    • Indices
      • Africa
        • Egypt
      • Australia
      • European Indices
        • AEX – Index, Amsterdam
        • DAX Index
        • Istanbul
        • Russia
        • Spain’s IBEX 35
      • Asian Indices
        • India
        • China
        • Dubai
        • Kuwait
        • Kuala Lumpur
        • Pakistan
        • Saudi
        • Taiwan
      • US Indices
        • S&P500
        • Nasdaq
        • Dow Jones
        • Dow Jones Utilities
    • Stocks
      • Asian Stocks
        • Indian Stocks Trading
        • Dubai Stocks Outlook
        • Japanese Stocks
        • Kuwait stocks
        • Saudi Stocks Outlook
      • African Stocks
        • Egyptian Stocks
      • Swiss Stocks
      • Australian Stocks
      • European Stocks
      • US Stocks outlook
      • UK Stocks
  • Commodities
    • Copper
    • Gasoline
    • Gold
    • Natural Gas
    • Oil
    • Palm Oil
    • Raw Sugar
    • Rubber
    • Soybean Oil
    • Silver
  • Forex
    • AUD
    • Bitcoin
    • CAD
    • CHF
    • Euro
    • GBP
    • INR
    • NZD
    • JPY
  • Raves
  • Consulting
    • Consulting
  • Ramki’s Watchlist
Top News

Has Meta (Facebook) stock seen the bottom

March 21, 2022

What Is The Nearest Technical Support For Meta (NASDAQ: FB)

February 7, 2022

Using Elliott Waves to Capture a Trade in S&P500

January 27, 2022
Facebook Twitter Instagram
WaveTimes Blog WaveTimes Blog
Wave times
  • About
  • Elliott Waves
    • Elliott Waves Explained
    • Elliott Wave Magic Illustrated with Wave Charts
    • Elliott Wave Edge – How Elliott Wave Traders Win
    • Fibonacci Number Series and Elliott Waves
    • How to use Fibonacci Ratio Retracements
    • Elliott Wave Books
      • The Elliott Wave Book – Five Waves to Financial Freedom
      • Dividend Growth Investing Using Elliott Waves
    • Videos
  • Equities
    • Indices
      • Africa
        • Egypt
      • Australia
      • European Indices
        • AEX – Index, Amsterdam
        • DAX Index
        • Istanbul
        • Russia
        • Spain’s IBEX 35
      • Asian Indices
        • India
        • China
        • Dubai
        • Kuwait
        • Kuala Lumpur
        • Pakistan
        • Saudi
        • Taiwan
      • US Indices
        • S&P500
        • Nasdaq
        • Dow Jones
        • Dow Jones Utilities
    • Stocks
      • Asian Stocks
        • Indian Stocks Trading
        • Dubai Stocks Outlook
        • Japanese Stocks
        • Kuwait stocks
        • Saudi Stocks Outlook
      • African Stocks
        • Egyptian Stocks
      • Swiss Stocks
      • Australian Stocks
      • European Stocks
      • US Stocks outlook
      • UK Stocks
  • Commodities
    • Copper
    • Gasoline
    • Gold
    • Natural Gas
    • Oil
    • Palm Oil
    • Raw Sugar
    • Rubber
    • Soybean Oil
    • Silver
  • Forex
    • AUD
    • Bitcoin
    • CAD
    • CHF
    • Euro
    • GBP
    • INR
    • NZD
    • JPY
  • Raves
  • Consulting
    • Consulting
  • Ramki’s Watchlist
WaveTimes Blog WaveTimes Blog
Home » India's Sensex: Elliott Wave Analysis
India

India's Sensex: Elliott Wave Analysis

RamkiBy RamkiJune 21, 20097 Comments2 Mins Read
Facebook Twitter LinkedIn Telegram Pinterest Tumblr Reddit WhatsApp Email
Share
Facebook Twitter LinkedIn Pinterest Email

bsesn21jun09b

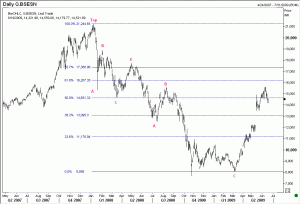
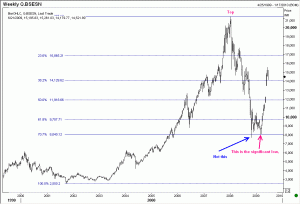
Is there one right way to count the waves? I can say this for sure. Until a move is over, there is certainly more than one way to count. Sometimes, even after a move is over, one has to decide where exactly the move finished. Take the case of India’s Sensex. Many Elliott wave analysts would say that the move finished at 7,697 on 27 Oct. After all, didn’t we get a sharp rally from there to 10,945? bsesn21jun09aBut it is perfectly possible to argue that that low was only the end of a huge 3rd wave, and the real end of the move happened on 6th March at 8,047. I am going to take the latter approach, at least for now. I have two main reasons for this, and the first two charts to illustrate why I prefer to call 8,047 as the real low.bsesn21jun09c 
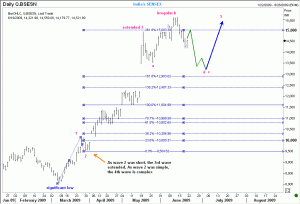
Having decided that we should start counting the new waves from 8,047, one should decide how to label the rally that reached 15,600. This is also illustrated in the 3rd chart that you see here.  As you can see, I am making a whole bunch of assumptions, and anything can go wrong. However, you get a feel of the challenges that a wave analyst faces when deciding where the market will go next. It is perhaps these arbitrary labelling that causes many traders to dismiss wave analysis as utterly useless. However, my contention is even if we get the labels wrong, we will probably be right in the direction of the next move, and that itself is worth the effort.

Share. Facebook Twitter Pinterest LinkedIn Tumblr Telegram Email
Previous ArticleTata Steel breaks support
Next Article Fifth wave opportunity: USD/YEN case study
Ramki
  • Website

Related Posts

How Elliott Waves helped WaveTimes members to exit before the stock market crash

March 27, 2020

How we traded Castrol India using Elliott Waves

December 9, 2019

Nifty rallied up in 5 waves

July 10, 2015
View 7 Comments

7 Comments

  1. V.GOPATHY on June 22, 2009 8:18 am

    Thank you for taking Sensex for the discussion.

    Is the wave which started from the significant low can be called as the impulse wave or correction wave.

    Reply
  2. Sunderindia on July 13, 2009 4:17 am

    Hi Ramki:

    I am excited about your experience and insight into analysis of stocks around the world. Your hobby is really hair raising. Am keen to know your analysis on future trend of India stock market in July-09. Why did you stop it with 21-06-09 post? Am visiting your site daily and would like to see your post everday on India stock market. Hope your time permits.

    Reply
  3. Ramki on July 19, 2009 6:07 am

    Hi Sunder, I will publish a report on India tomorrow.

    Reply
  4. Sunder on July 28, 2009 10:43 am

    Hi Ramki,

    Looking forward to your report on Indian Stock/Market; Where is it now in Elliot Waves

    Reply
  5. Ryan on August 2, 2009 8:12 am

    Ramki– Reviewing your chart on sensex- RIGHT ON! Where do you see wave 5 beginning? By the way- wave 4/c was almost perfect on timing and level… this was a great call

    Reply
  6. PRAKASH SHARMA on December 15, 2009 4:43 am

    Hi Ramki
    I am new to Technicals.Still I wish to know the 5 waves count targets for the Indian markets as on date 15.12.2009

    regards

    Reply
  7. DWIPAN KUMAR PAUL on May 1, 2010 9:53 pm

    I think the fall from 21300 to 8000 was in 5 waves motive. The current trend is corrective ABC and next is terrible 5 wave fall agin. Prechter has already put fire alarm on US market

    Reply

Leave A Reply Cancel Reply

Recent Posts
  • Has Meta (Facebook) stock seen the bottom
  • What Is The Nearest Technical Support For Meta (NASDAQ: FB)
  • Using Elliott Waves to Capture a Trade in S&P500
  • Hedge Funds and Elliott Waves – Netflix $NFLX
  • When Elliott Waves applauds the promoter’s signals!

WaveTimes is a Research Organization dedicated to providing original analysis, reports, reviews, and insights on developments in mutual funds, stocks, investing, foreign exchange, commodities, and bonds.

Contact WaveTimes

L-601 Mantri Espana,

Kariyammana Agrahara, Bellandur, Bangalore 560103

Follow Us

  • Facebook
  • YouTube
  • Twitter

© 2023 Wave Times. All Rights Reserved.
  • About
  • Books
  • Privacy Policy
  • Policies and Standards

Type above and press Enter to search. Press Esc to cancel.