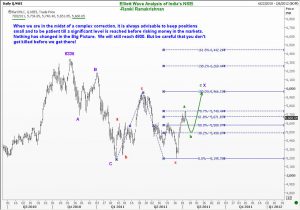
 The outlook for NSEI in the big picture is unchanged, in that we will eventually see it down to 4800. Investors should thus be patient for at least that level if they wish to purchase stocks for the long term. The recent gyrations must have tested all short term traders quite severely. Many must have become convinced that we are going down directly too late in the game, and turned short at all the wrong levels, with the attendant consequence of having to take a loss. Others who were waiting to buy must have bought near the recent highs after having kicked themselves for having waited too long (for the elusive 4800) and will likely pay the price when we get the inevitable move lower. And so the story goes.
Who really makes money (other than brokers)? While some will share with you tales of their success, they will not talk about their defeats. Be assured that trading is a game where everyone suffers at some time or the other. However, if one can choose to be a passive onlooker until the market reaches a critical level, then there is money to be made. There will still be some episodes of losses, but these losses will be manageable.
Coming to the chart of NSEI that I have published today, you will observe that the X wave has now been shifted to the right. Is this the final version of the chart, you may ask. There is no way of telling. The recent rally to 5740 area (slightly higher than the ideal level of 5720) looks like a 5-wave move. So maybe we will get one more recovery after a dip. Your clues will now depend on the presonality of the waves that will unfold. If you don’t know about wave personalities, then I strongly recommend that you revisit the text book. If the sell off is quick, then you will stay aside. If the decline is slow, you will probably test the waters by buying small amounts at the 50% pull back of the recent rally. Remember, Elliott Wave Analysis is a trading tool, not a forecasting machine.
Good luck to all Ye Punters! I am surprised at the number of comments that the posts relating to NSEI have received. Thank you all for taking the time to write. I have been busy and not able to update as often as I’d like.

