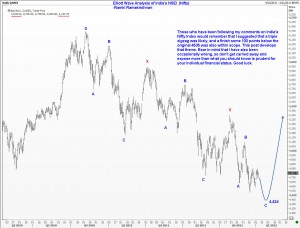
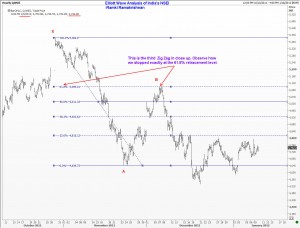
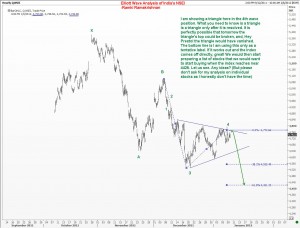
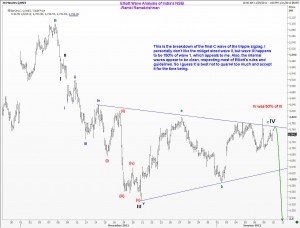
India’s Nifty stock index has been moving sideways for a few days. Having staged a decent recovery from the 4535 level that WaveTimes had identified as a key level some time back, many readers are anxious to know if we have seen the bottom. As WaveTimes has a truly global following, I had to look at other asset classes before coming back to Nifty. The attached charts explains in detail my current thinking. Read, Enjoy and Share! By passing these comments to your friends, you are not only helping them, but also giving back to the trading community in your own way.
- About
- Elliott Waves
- Equities
- Commodities
- Forex
- Raves
- Consulting
- Ramki’s Watchlist
Previous ArticleEURUSD outlook Elliott Wave Analysis
Next Article Bajaj Auto – Elliott Wave Analysis
79 Comments
You are freakin awesome.
Hello Ramki,
Thanks for the timely update.
Wave labeling in the latest chart is lot different from the previous one. Inserting “X” wave changed the outlook from start of the bullish move to bearish one.
Instead of being in wave3 of Wave1, we are now in wave4 of wave C.
Greatly appreciate if you could throw more light on what prompted you to adopt this alternate wave counting?
Also, triple Zig-Zag, how common is it?
Regards,
–RamV
Hi RamV, my approach is EWP is to make it work for us, for our trades. So I change the count when I feel it is time to do so. However, I have been consistent with Nifty counts, I believe. Triple zigzags are becoming more comwmon in the current market environment. Trouble is you can’t anticipate it before it starts unfolding.
Hi,
your charts,comments and observations are simply spellbinding
truckloads of thanks for helping traders
dear sir
thank you very much for posting your long waited view on nifty
Sir, Great analysis. Here all the analysts were predicting for an upmove to 5000 zone before a big fall to 4400 or lower level. You have precisely pointed out that this leg may be the last of the downmoves, and we may be very near the bottom.
Hi Rajesh, we always need to be aware that nothing is certain. I could be wrong too!
Sir, I cannot explain in words your expertise in analysis. Thank You so much for the
Nifty analysis so perfectly explained. You have removed my dilemma regarding the
above. I will really sleep well tonight.
Thanks once again.
Good night.
Dr Sanjay Pote.
Dear Sir,
This is indeed a complex chart to count E waves.
I have 2 questions:
1. In C wave, why did you count Wave I ending at ~4950, why can’t it be ~4850 (where you labeled subwave 1 within 3rd wave of C)
2. Triangle should have 5 sub waves, but here you have marked only 3 waves, waves d & e shuould not form within triangle before final 5th wave starts ?
Hi Dinesh, there are always many ways of counting a move, and we will never know which is right Neil the move is over. We just have to follow the rules & guidelines of the theory to tell you when your count is wrong. Some triangles have 3 steps inside.
Sir,
I have purchased your book. No doubt this the most simple & to the point script.
I am regular reader of your website, very interesting & educative articles are posted from time to time.
What I find in elliott wave is THE COUNT of waves , the most & the must understanding one should have.
May I suggest you to please to write an article only on WAVE COUNT in detail for your fans. A full Bull/bear cycle chart with wave count of implusive, corrections & ABC & comments on fibonacci will work like a model template.
Thanks
jk Pahuja
Hi JKP, thanks for your comments. You should realize that no two waves are exactly the same. But the overall framework is there, and this has been explained in detail in the book. If you read the book again, and also look through the hundreds of examples in the blog, your understanding will be greatly enhanced. Good luck.
A sharp reaction. This morning market is above 4800. If the closing is above 4800.., will it negate the above count?
Hi Rajesh, the triangle has vanished as discussed yesterday. Remember the goal has been to pick low risk entry levels. There hasnt been any recommendation to sell. Let us allow the market to run its course and we will be patient until we know it is time to move in.
Sir,
Triangle has vanished? you mean the count does not hold good anymore?
Hi Vineet, Do I sense an alarm in your question? When dealing with the markets, we have to bear in mind that chart formations that hasnt happened yet are only in our imagination. If it develops as planned, thats great. Else, we wait for the next clue. Yes, the short term count has to be re-worked. But there is no change as yet in my target.
does it mean that target of wave e i.e 4420 on nifty still holds?
Hi Suresh, Yes, when there is a change in the outlook, I will discuss that again. For now, we should sit aside and wait.
Sir, Great Work sir.
Hope to see Nifty Down at 4400
I think mkt has given enough opportunities for people to square of their longs and correct their positions.
Ramki ji ,
Thanks a lot for the simple and clear representation of the complex Nifty moves 🙂
what is the time frame you see for the target of 4500- 4400 ???Could you also post your views on how one can deduce the potential time needed for the move.
Also how many legs do u see for the short term upward movement now which has violated the envisaged triangle pattern?
Thanks!
Hi Ananth, Make no mistake, today’s surge is strong, and the markets have closed near the highs. We could see continuation in the next few sessions unless we get some bad news. But I still think we are not in a clear bull market. Hence, I would prefer to wait for some fresh clues.
Ramki sir,
Please correct me if i am wrong. The triangle is out of question now but regular correction is still a possibility and failure of moving above 4980 (I) and later any movement below 4800 will confirm that ? sir, alternatively can we be in a 5 wave up move which does not look really convincing right now.
Hi Pankaj, Looks like you have nailed it. I want to see the markets move up a little more, perhaps to 4920 area, and then come down to trade below 4795. Such a development will make me quite happy because we can then congratulate ourselves for not having been caught in a false move. HOwever, if for some reason the matket continues to trade higher and higher, we will wait for a 50% correction before thinking of buying. The focus is ALWAYS on taking low-risk trades.
SIR,can nifty go to 3400 next year
Nifty 61.8% retracement from 5100 to 4530 is around 4885. Great levels to try shorts….
Hi Ramki,
Thanks for the analysis. Nifty behavior these days is becoming an Edge of seat thriller which has glued us to this analysis! Nifty Spot today made a high of 4854 with a surge of 106 points. Could this be developing into any other interesting wave pattern?
Regards,
/Arian
Arian, we have to wait for additional clues before deciding next course of action.
ramki sir,
I was trying to label crompton greaves. It looks to be a good candidate for having completed ABC regular correction from 2009 highs. Watching to see if a small 5 wave up move happens here.
sir small abc took 25 and 30 days,while x and xx took 38 and 41 days …while last ab took only 7 days,,,,so maintain similarity of cycle it can touch 51oo and than go for down,means running upwave is smaller c wave of b wave…date 6 th to 8th feb is important…
Hi VijaySinh, As I often say, just about anything is possible. We have to trade our theory! Good luck.
Dear sir,
Still your target valid for wave 5 in nifty i.e.4424 because probably today nifty topped out. A candlestick pattern evening star is on chart. also infosys was 8 % down today supporting the top. by fibonnaci projection, now 61.8% from todays high is coming somearound previous bottom. so will nifty bottom out in form of double bottom. Or what i am assuming this is ending diagonal “d” wave and “e” should end around 4400 whats ur view…..pls express…..
Ramki sir and others,
Eicher motors looks like a text book shorting opportunity. We are currently in wave c of B wave. Wave A was in 3 waves to it will be a flat correction. My analysis says to look for a shorting opportunity close to 1690 levels for a target price of minimum(because 38% retracement of 5way move from 2009 lows is below 1200) target price of 1300.
Ramki sir,
Nifty went to 4900 and reversed sharply…first signs that overlap can happen. Typically should one get out of any longs bought earlier when an overlap happens immediately..or wait for 3 wave pull back before getting out. ??
Hellp Pankaj, Thanks for the comments, but it will be great if you could such ideas on the forum instead.
Ramki sir,
I have posted Eicher charts on the forum. Will be exciting to see your comments on the same. Thanks
Hi Pankaj, Unfortunately I wont be able to look at all the charts people send me. However, if your comment is on the Forum, I am sure other members will be interested to view it and give their valuable comments. Good luck!
Dear Ramki Sir,
Wish You Happy Pongal………Nifty analysis so perfectly explained. Thanks for Great Work sir. i have learn more with your charts,comments….
Sir,
Is it possible that the 1st Wave of c completed at 4530 and at present we are in correction wave 2 of c which can go upto 5125-30……and then the 3rd wave would unfold.
pls advice
Hi Sidharth, that is of course possible, but it is too early to confirm.
Ramki sir,
Do we need to modify the current count seeing today’s move in nifty ? If yes, would u think this is a 5 wave up move going on or you would just work backwards and think we are still in a correction ?
Pankaj, That we need to change the count was evident a few days ago. As I have said in replies elsewhere, we have probably missed a nice opportunity down there by remaining over optimistic for further weakness below 4530. I will post an update once there is clarity
sir, i sold one lot mininifty @ 4800 when should i cover my short.
Sir,I sold 2lote big nifty 4800 when should I cover my short
Hello Inderjit and Rajkumar, Forgive me, but I am not offering any trading advice in this blog. We discuss trading ideas and potential set-ups to take low risk trades. The idea is to equip readers with the tools to make informed decisions. I don’t remember ever suggesting to sell Nifty at 4800.
sir,
Thank you for immediate reply, now at this point what is advise , will i carry short position or book out loss. please suggest me.
Sir,
At this time, Nifty is 4975. It might be due to short covering and Nifty goes higher and higher. It has crossed 61.8% retracement level. In past Nifty had reached 80% retracement level. I think it may reach to 4986 i.e. 80% retracement of 5100-4530. If it cross 4986, ………………
otherwise it will correct and reach to 4424
Hi Salim, In other words, you are agreeing that just about anything could happen. true. So how do we deal with it. Read my update today
Sir,
At this time, Nifty is 4975. It might be due to short covering and Nifty might go 5071. It has crossed 61.8% retracement level. Sir i have sell nifty 4975. Please advise me should i carry my sort ?………………
Hi PK Chaudhary, I am sorry that I cannot give individual trading advice. I hope you will understand why.
Hi Ramki,
Can you please post an updated NSEI (NIFTY) chart. It will be interesting learning for a student like me on how we could have seen what really happened because I think the past 1 month move was out of the ordinary and more complex perhaps .. and I for one have not been able to label it correctly.
Thanks for this website and for your book. Again, you are really good!
Vivek
Sir,
Requesting to update with levels and help to get out of the trap.
Thanks & regds
Vijay
Hi Vijay, sorry for late response. My best advice to anyone who is trading is to have a pre-determined stop that is small and affordable. My own experience over the years shows that almost every time I wait for a move to comeback, it keeps getting worse. Which is why, even if it is painful, I would rather take a small loss and forget the trade. Take for instance a recent Gold update where a stop was placed at 1665. It went to 1745.Waiting for it to come back (which it will eventually do, but maybe from 1807, or much higher!) makes no sense.Good luck
ramki sir, we are waiting for your latest updat on nifty .now nifty at 5200 and no seems any diriction where is trend.sir 200 dma is crosed ,experts are saying 5700 will be the next target.
Hi Ritesh, your best bet is to do your own analysis using the techniques I have taught and stop listening to experts, including myself! You should come to wavetimes to learn, not to get trading tips.
Sir,
In the month of jan nifty has moved upward & crossed 5067 key resi area & touched almost .78% retracement from 5399 to 4531. now i think first target of nifty is 4824 then it will move toward 5093 then we will fined the bottom somewhere around 4424 to 4460. sir whats your opinion on nifty ?
pankaj
Hi Panaj, one four come up with ny number of counts and ideas, but we won know till later which is correct. I am not so bearish as you.
thankz sir,i am going to buy your book and also intrested to learn wave principle.sir your posts useful for us.
whats your view now on Nifty?
Hi Ramki,
Would appreciate having an updated count on the Nifty, after today’s surge, which typifies an ending diagonal based on the 1-3 trend line break, and some kind of basis.
Thanks In Advance.
Yesterday we have probably finished the 3rd wave at 5598-5602 area.Now we are on the 4th of the FIFTH WAVE.This correction may drag down Nifty to 5490 or 5430 levels.Then the final fifth of wave 5 would commence. Thanks Ramki for your great help.You really are wonderful.I know that this fifth of the wave 5 would make me very rich.Five waves to financial freedom is awesome !But when I compute the length of the fifth of the wave 5,as suggested by you in your book,I am speechless.Are we really heading to a new high in the very short term?I keep wondering.Please comment.
Ashurosh, only when the fifth wave is an extension can you make fast money. Are you sure we didn’t get n extended third?
Yes Sir;
You are right here.We sure got an extended 3rd wave.If I can recognize that my wave counts are correct so far, and that we are on the first of the bullish run, the waves to come would sure make me a rich man.I am grateful to you for your great work.
Ashurosh, you should keep all possibilities in mind. What will happen if Greece defaults, for example
Ramki sir,
Thanks for your wonderful work on EWs !
When time permits could you have a look at NIFTY and update the latest please.
Best rgds, Sanket
Hi Sanket, Thanks for your comments. I will do a Nifty update soon. PLease use the forum to share your counts with other friends in our exclusive club!
Dear Ramki Sir,
Please post Nifty Analysis as weekly basis.
Please ..
Regards
Alok Surana
Hi Alok, Sure, I will be doing a Nifty update soon
Sir – we are eagerly waiting for your analysis…!!
Thanks a lot !
Everyone….Ramki sir posted the analysis in following thread…!!
http://www.wavetimes.com/looks-like-indian-stock-market-rally-is-fading-nseindia/
Hi Sanket, Thanks for your comments. I suggest you direct your dicsuions to the Forum because then you can have a two-way interaction with others. Best.
Pivot method is really one of the best way to assume supports and resistances in NIFTY.We would like to request you to have a look in our NIFTY charts page (….) Keep up the good work..
Hi Debashis, Thanks for reaching out. You appear to have a slick website.
sir,monthly basis
wave 5 is 6134 (10 des 09)
wave a. 6135 to 5333
wave b.5333 to 5833.75
wave c.5833.75 to 4943.25
abc complete and x.abc wave started
x 4943.25 to 5325
wave xa. 4624.30 to 5385
wave xb. 5385 to ……? if wava x fall 1200 points 5325 to 4943.25..xb fall the same..from 5385 to 4185..
Hi Ritesh, thanks for posting your counts. There can be several on going counts (as all counts are only tentative – see my book) You need to known when your count is wrong, and get out at that time. Till then you trade your view
sir,i am learning…so may be wrong..thankz to reply me.
sir…5 waves sab wave abc and xabc completed…
Now y wave in prograce…
Y wave up 4623 to 5623
y wave down xxx…..?
Hi Ritesh, Any count is possible, You have to ‘trade’ your count, and stick with it till proved wrong
Dear Sir,
Have been studying to understand Elliot Wave for the past three years. Last six months i have apllied what i think is wave……Given below Nifty Wave Count…..pl correct me if am wrong….
4531.15-4800.5 Wave 1…When we extend the calculation we got a final target of 5441. The Wave 1 retrace 78.6% at 4588 and close the same day at 4636. 61.8% of wave 1 is 4633. Yours truly was jus about getting some little understanding of wave and this got me more interested
On 15 the feb the market made a high of 5442…..When this happened i got little confident that am on the right track. The wave got extended and made a high of 5629.95.
My query is Big Wave 1 from 4531 to 5629….if i can call it that way…..can it retrace 78.6%…….why am asking is 78.6% retrace of 4531 and 5629 is 4766…..to my astonishment Nifty Future low yesterday ws 4767.45 while spot made a low of 4788.
Is it possible for nifty to turnaround from this level.
Similarly for USD INR we had a Wave target of 52.58 . Now it is extending. My wave count for USD 48.83-49.94 Wave 1 . How much further can it extend. Also it has a double top 54.63….on 16/12/2011.
Also we have several observations for which we need your views/clarifications. Can we mail you the same
tks
rgds
Venkatesan
Hi VSV, thanks for writing. It is possible to have many counts at any time. However I am currently on holidays.