• About
  • Elliott Waves
    • Elliott Waves Explained
    • Elliott Wave Magic Illustrated with Wave Charts
    • Elliott Wave Edge – How Elliott Wave Traders Win
    • Fibonacci Number Series and Elliott Waves
    • How to use Fibonacci Ratio Retracements
    • Elliott Wave Books
      • The Elliott Wave Book – Five Waves to Financial Freedom
      • Dividend Growth Investing Using Elliott Waves
    • Videos
  • Equities
    • Indices
      • Africa
        • Egypt
      • Australia
      • European Indices
        • AEX – Index, Amsterdam
        • DAX Index
        • Istanbul
        • Russia
        • Spain’s IBEX 35
      • Asian Indices
        • India
        • China
        • Dubai
        • Kuwait
        • Kuala Lumpur
        • Pakistan
        • Saudi
        • Taiwan
      • US Indices
        • S&P500
        • Nasdaq
        • Dow Jones
        • Dow Jones Utilities
    • Stocks
      • Asian Stocks
        • Indian Stocks Trading
        • Dubai Stocks Outlook
        • Japanese Stocks
        • Kuwait stocks
        • Saudi Stocks Outlook
      • African Stocks
        • Egyptian Stocks
      • Swiss Stocks
      • Australian Stocks
      • European Stocks
      • US Stocks outlook
      • UK Stocks
  • Commodities
    • Copper
    • Gasoline
    • Gold
    • Natural Gas
    • Oil
    • Palm Oil
    • Raw Sugar
    • Rubber
    • Soybean Oil
    • Silver
  • Forex
    • AUD
    • Bitcoin
    • CAD
    • CHF
    • Euro
    • GBP
    • INR
    • NZD
    • JPY
  • Raves
  • Consulting
    • Consulting
  • Ramki’s Watchlist
Top News

Has Meta (Facebook) stock seen the bottom

March 21, 2022

What Is The Nearest Technical Support For Meta (NASDAQ: FB)

February 7, 2022

Using Elliott Waves to Capture a Trade in S&P500

January 27, 2022
Facebook Twitter Instagram
WaveTimes Blog WaveTimes Blog
Wave times
  • About
  • Elliott Waves
    • Elliott Waves Explained
    • Elliott Wave Magic Illustrated with Wave Charts
    • Elliott Wave Edge – How Elliott Wave Traders Win
    • Fibonacci Number Series and Elliott Waves
    • How to use Fibonacci Ratio Retracements
    • Elliott Wave Books
      • The Elliott Wave Book – Five Waves to Financial Freedom
      • Dividend Growth Investing Using Elliott Waves
    • Videos
  • Equities
    • Indices
      • Africa
        • Egypt
      • Australia
      • European Indices
        • AEX – Index, Amsterdam
        • DAX Index
        • Istanbul
        • Russia
        • Spain’s IBEX 35
      • Asian Indices
        • India
        • China
        • Dubai
        • Kuwait
        • Kuala Lumpur
        • Pakistan
        • Saudi
        • Taiwan
      • US Indices
        • S&P500
        • Nasdaq
        • Dow Jones
        • Dow Jones Utilities
    • Stocks
      • Asian Stocks
        • Indian Stocks Trading
        • Dubai Stocks Outlook
        • Japanese Stocks
        • Kuwait stocks
        • Saudi Stocks Outlook
      • African Stocks
        • Egyptian Stocks
      • Swiss Stocks
      • Australian Stocks
      • European Stocks
      • US Stocks outlook
      • UK Stocks
  • Commodities
    • Copper
    • Gasoline
    • Gold
    • Natural Gas
    • Oil
    • Palm Oil
    • Raw Sugar
    • Rubber
    • Soybean Oil
    • Silver
  • Forex
    • AUD
    • Bitcoin
    • CAD
    • CHF
    • Euro
    • GBP
    • INR
    • NZD
    • JPY
  • Raves
  • Consulting
    • Consulting
  • Ramki’s Watchlist
WaveTimes Blog WaveTimes Blog
Home » Identifying the end of a trend: Citi
US Stocks outlook

Identifying the end of a trend: Citi

RamkiBy RamkiDecember 15, 20086 Comments2 Mins Read
Facebook Twitter LinkedIn Telegram Pinterest Tumblr Reddit WhatsApp Email
Share
Facebook Twitter LinkedIn Pinterest Email

A lot of traders are under the impression that technical analysis will give  cut and dried answers to their trading challenges. Many of those who practice Elliot wave analysis also have this notion. How I wish life was so simple! All that technical analysis does is to give you a structured approach to the market. It allows you to enter the market at levels where you can define your stop loss levels, and take an informed view about how far the next move can go. It is ALWAYS an exercise in probability. As you gain experience, you become better at the game, and make less frequent incorrect calls. A good wave analyst is not so much concerned about incorrectly labeling a move provided he has the ability to ‘think’ on his feet. ie. he constantly adjusts his count as the market sends him new signals. Even if he identified the end of a trend incorrectly, he would have made the correct call about the likely next direction, unless he was ‘wrong – WRONG”.

With that short background, I present you the chart of Citi, showing how I labeled the end of the trend incorrectly on 3 different times in the past, yet ended up making money. (The one time I lost was when what seemed like a diagonal triangle turned out to be something else, but even that gave me a decent level to exit the following day)

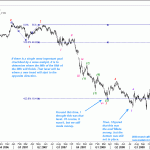
citi-15-dec-08

Share. Facebook Twitter Pinterest LinkedIn Tumblr Telegram Email
Previous ArticleDr.Reddy's Laboratory trade idea revisited
Next Article Elliot wave analysis of SBA Comms Corp
Ramki
  • Website

Related Posts

Has Meta (Facebook) stock seen the bottom

March 21, 2022

What Is The Nearest Technical Support For Meta (NASDAQ: FB)

February 7, 2022

Hedge Funds and Elliott Waves – Netflix $NFLX

January 17, 2022
View 6 Comments

6 Comments

  1. Adam on December 15, 2008 7:20 pm

    Ramki,

    So if I read you post correct, you still think C may fall into the wave with this last dip? I have been following C and your posts for many months now and have been extremely patient taking small gains here and there waiting for the big payout… Any additional insight would be appreciated!!

    Reply
  2. Ramki on December 15, 2008 9:59 pm

    I think there will be one final dip in Citi that need not necessarily go to new lows. After that we should get the first real rally that will take it initially to the most recent high (marked iv). After that we will get one small dip of maybe 50% of that rally and that will be all. Thereafter, we should buy Citi on every dip. But first, let us wait for the current decline to run out of steam, and we will already get some clues on the way. I will keep the blog updated as we go along! Good luck.

    Reply
  3. David on December 16, 2008 2:23 am

    Thanks Ramki! Do you subscribe to this being minor 5 unfolding of 3 or to my preferred count that we are in a zig zag of intermediate 4 ?

    Reply
  4. Ramki on December 16, 2008 4:21 pm

    Sorry David, I need to see a chart with your counts on it before I comment. (Sigh. It has been a long and tiring day here). Send me a link, or better still, post a link here so others can also see what we are discussing. Thanks.

    Reply
  5. Subramania Kaushik on December 20, 2008 9:10 pm

    Hi Ramki,

    Do you think Citi is a good buy at current level of $7? Appreciate your thoughts.

    Thanks,
    Kaushik

    Reply

Leave A Reply Cancel Reply

Recent Posts
  • Has Meta (Facebook) stock seen the bottom
  • What Is The Nearest Technical Support For Meta (NASDAQ: FB)
  • Using Elliott Waves to Capture a Trade in S&P500
  • Hedge Funds and Elliott Waves – Netflix $NFLX
  • When Elliott Waves applauds the promoter’s signals!

WaveTimes is a Research Organization dedicated to providing original analysis, reports, reviews, and insights on developments in mutual funds, stocks, investing, foreign exchange, commodities, and bonds.

Contact WaveTimes

L-601 Mantri Espana,

Kariyammana Agrahara, Bellandur, Bangalore 560103

Follow Us

  • Facebook
  • YouTube
  • Twitter

© 2023 Wave Times. All Rights Reserved.
  • About
  • Books
  • Privacy Policy
  • Policies and Standards

Type above and press Enter to search. Press Esc to cancel.