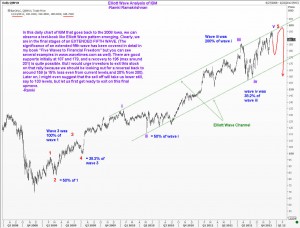
 In his recent update in Forbes, John Navin mentioned IBM as one of the old warhorse stocks that is providing leadership in keeping the market well supported. John has some very good instincts and is an engaged partcipant in the US stock market. My being removed from the center of action perhaps allows me to review a chart dispassionately, and when I looked at IBM, it was easy to spot many interesting Elliott Wave patterns. These are all labelled clearly in the attached chart for your reference, so I won’t bore you with repeating the same stuff.
Your key take away from my post today is this. When a five wave rally approaches the end of its fifth wave, you must get ready for a correction that will be BIGGER and last LONGER than the previous two corrections. Now wave 4 went from 185.70 to 158.60, or $27. I am willing to wager that after we finish one more upmove, we will get a fairly aggressive sell off that will be at least $27. More likely, the downmove will take us to around 159, which is a significant move for most traders, and even for investors.
My only worry is I have been having such a wonderful run with my calls on Gold, Silver, Oil, Euro, Caterpillar, Apple, Indian Rupee and others that IBM could turn out to be the ‘correction’ I will eventually experience! Anyway, you have the chart with my comments and you can judge for yourself where I could go wrong. Good luck.

