The following charts are reproduced from what I sent a client who consulted with me. He has been trading EURJPY quite regularly and understands the intricacies of that market well. The objective was to figure out the near term outlook for the cross.
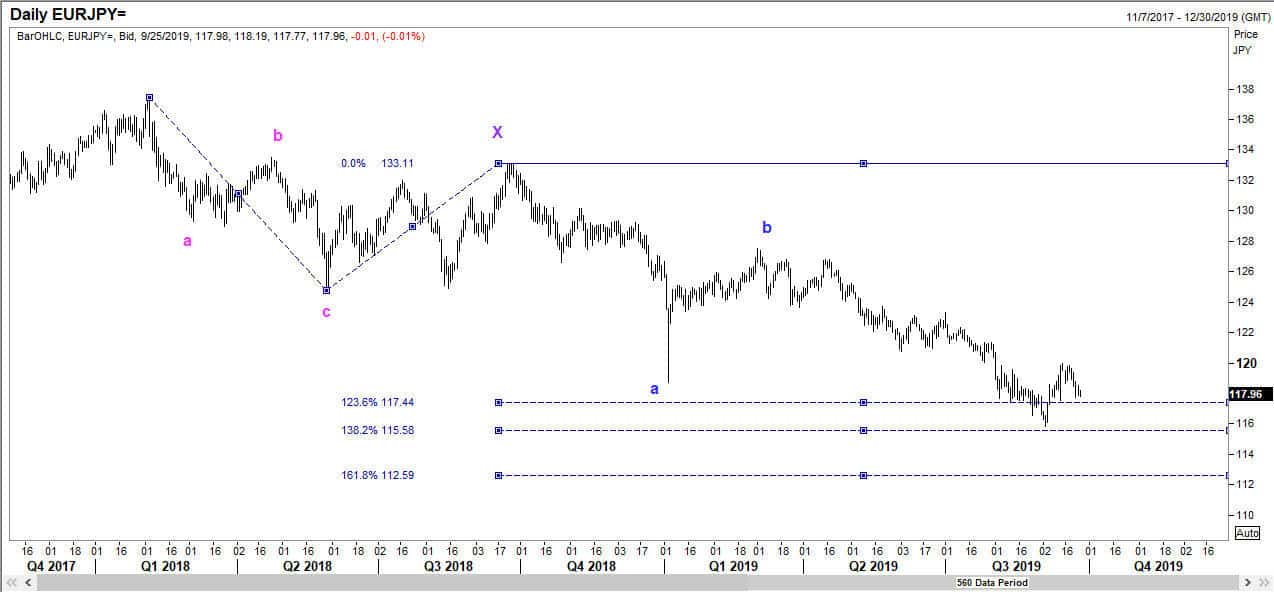
The first chart below lays out my hypothesis, that we were tracing a double three pattern, and we were in wave C of the second set.
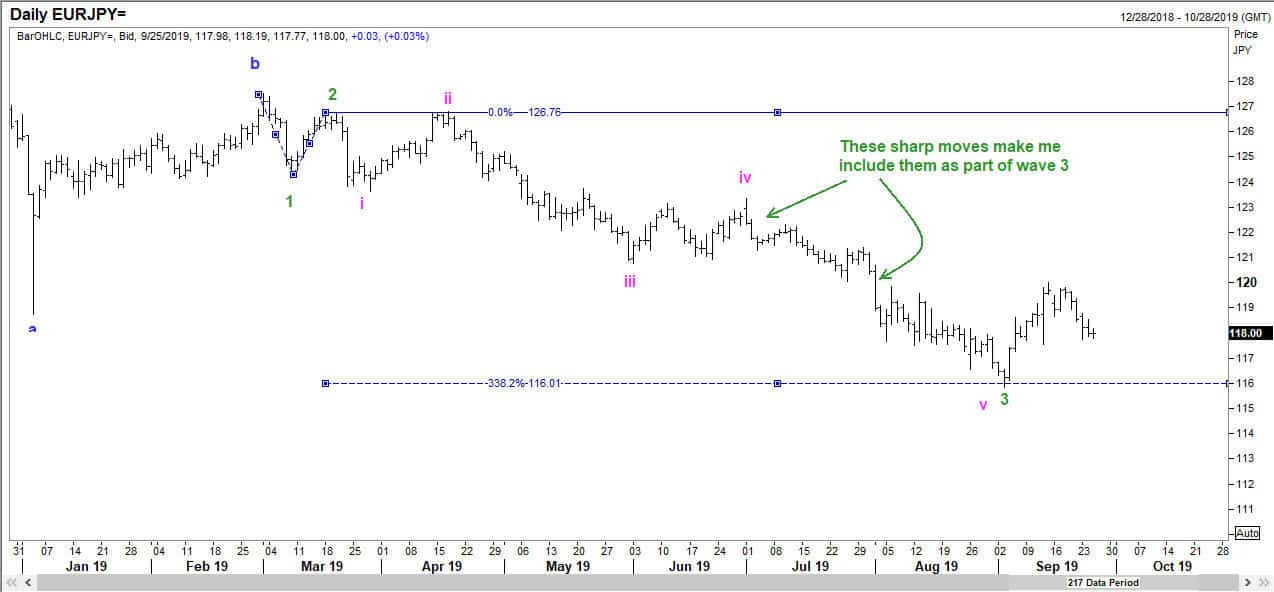
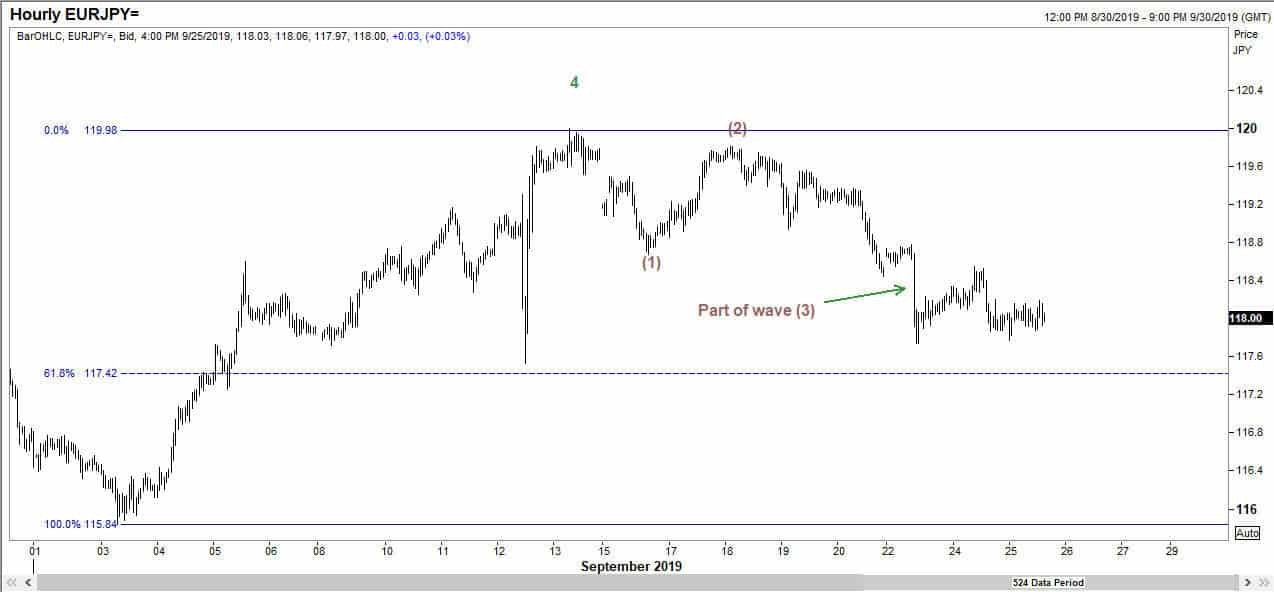
This next chart shows how I looked at the sub waves of wave C in the second set.
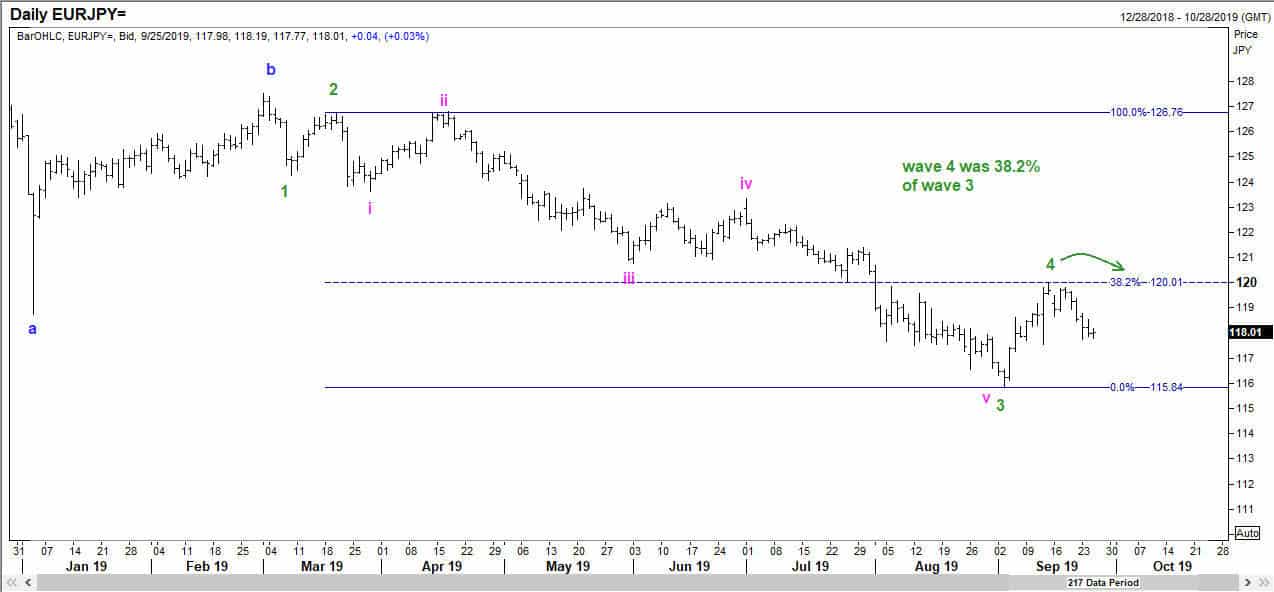
Then I established where wave 4 of C ended.
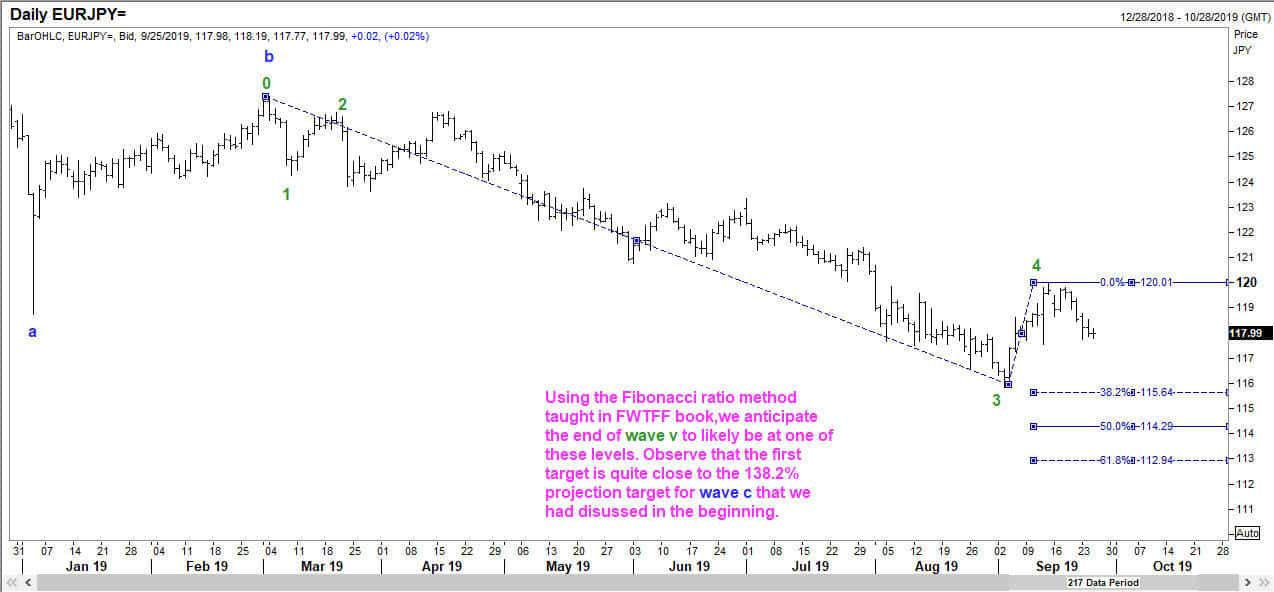
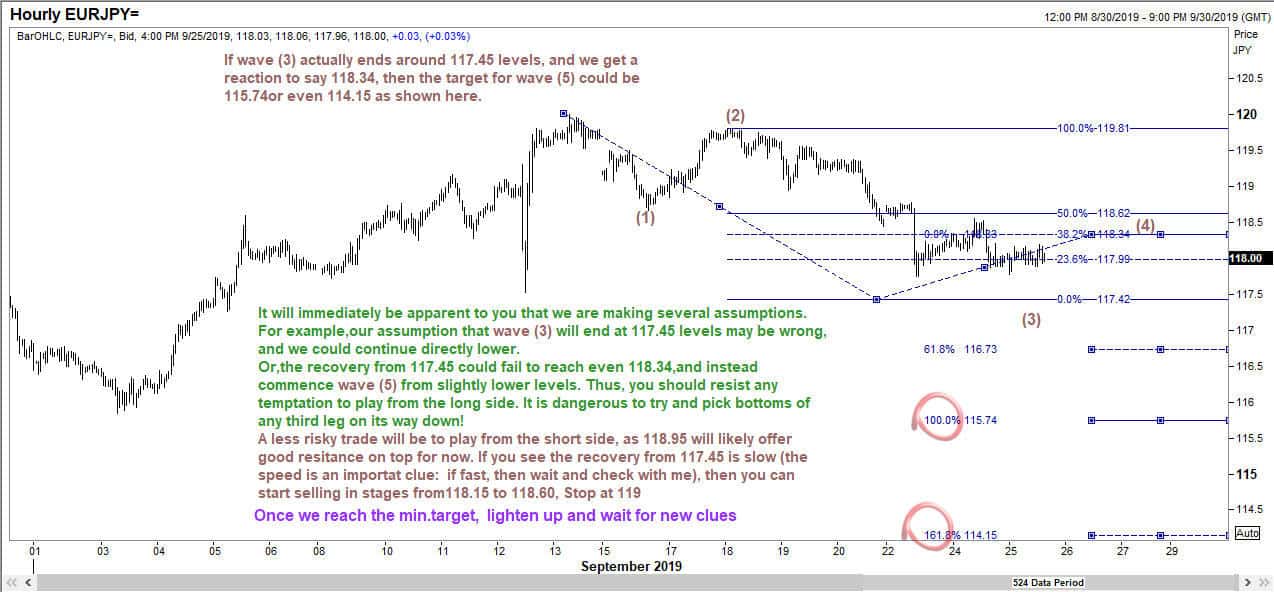
Then I figured out the likely targets for wave 5 of wave C as below.
But all of this was merely establishing a framework. I was aware that there were some key levels that could make a difference along the way. In order to trade in the short term, I had to focus on those levels. So I went into the intra-day chart and this is what I sent my client.
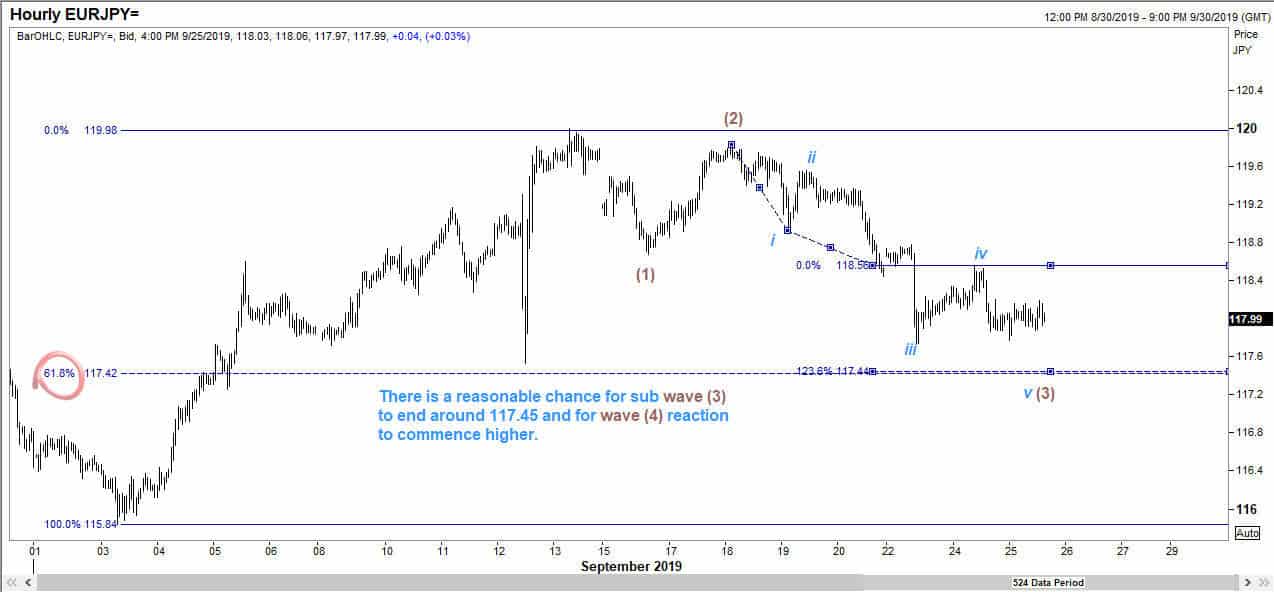
The key level was where sub wave (3) will likely end. And that came at 117.44 as shown here.
Finally, I sent this last chart to my client that suggested he sell in stages from 118.15 upto 118.60.
You can check what happened later. The low was 117.44 and we got a recovery to 118.34 after which we came down to 117.01.
This is just another example of how one can use Elliott Waves to trade in the short term. All of my wave counts are work-in-progress. I use them and then discard them!
