• About
  • Elliott Waves
    • Elliott Waves Explained
    • Elliott Wave Magic Illustrated with Wave Charts
    • Elliott Wave Edge – How Elliott Wave Traders Win
    • Fibonacci Number Series and Elliott Waves
    • How to use Fibonacci Ratio Retracements
    • Elliott Wave Books
      • The Elliott Wave Book – Five Waves to Financial Freedom
      • Dividend Growth Investing Using Elliott Waves
    • Videos
  • Equities
    • Indices
      • Africa
        • Egypt
      • Australia
      • European Indices
        • AEX – Index, Amsterdam
        • DAX Index
        • Istanbul
        • Russia
        • Spain’s IBEX 35
      • Asian Indices
        • India
        • China
        • Dubai
        • Kuwait
        • Kuala Lumpur
        • Pakistan
        • Saudi
        • Taiwan
      • US Indices
        • S&P500
        • Nasdaq
        • Dow Jones
        • Dow Jones Utilities
    • Stocks
      • Asian Stocks
        • Indian Stocks Trading
        • Dubai Stocks Outlook
        • Japanese Stocks
        • Kuwait stocks
        • Saudi Stocks Outlook
      • African Stocks
        • Egyptian Stocks
      • Swiss Stocks
      • Australian Stocks
      • European Stocks
      • US Stocks outlook
      • UK Stocks
  • Commodities
    • Copper
    • Gasoline
    • Gold
    • Natural Gas
    • Oil
    • Palm Oil
    • Raw Sugar
    • Rubber
    • Soybean Oil
    • Silver
  • Forex
    • AUD
    • Bitcoin
    • CAD
    • CHF
    • Euro
    • GBP
    • INR
    • NZD
    • JPY
  • Raves
  • Consulting
    • Consulting
  • Ramki’s Watchlist
Top News

Has Meta (Facebook) stock seen the bottom

March 21, 2022

What Is The Nearest Technical Support For Meta (NASDAQ: FB)

February 7, 2022

Using Elliott Waves to Capture a Trade in S&P500

January 27, 2022
Facebook Twitter Instagram
WaveTimes Blog WaveTimes Blog
Wave times
  • About
  • Elliott Waves
    • Elliott Waves Explained
    • Elliott Wave Magic Illustrated with Wave Charts
    • Elliott Wave Edge – How Elliott Wave Traders Win
    • Fibonacci Number Series and Elliott Waves
    • How to use Fibonacci Ratio Retracements
    • Elliott Wave Books
      • The Elliott Wave Book – Five Waves to Financial Freedom
      • Dividend Growth Investing Using Elliott Waves
    • Videos
  • Equities
    • Indices
      • Africa
        • Egypt
      • Australia
      • European Indices
        • AEX – Index, Amsterdam
        • DAX Index
        • Istanbul
        • Russia
        • Spain’s IBEX 35
      • Asian Indices
        • India
        • China
        • Dubai
        • Kuwait
        • Kuala Lumpur
        • Pakistan
        • Saudi
        • Taiwan
      • US Indices
        • S&P500
        • Nasdaq
        • Dow Jones
        • Dow Jones Utilities
    • Stocks
      • Asian Stocks
        • Indian Stocks Trading
        • Dubai Stocks Outlook
        • Japanese Stocks
        • Kuwait stocks
        • Saudi Stocks Outlook
      • African Stocks
        • Egyptian Stocks
      • Swiss Stocks
      • Australian Stocks
      • European Stocks
      • US Stocks outlook
      • UK Stocks
  • Commodities
    • Copper
    • Gasoline
    • Gold
    • Natural Gas
    • Oil
    • Palm Oil
    • Raw Sugar
    • Rubber
    • Soybean Oil
    • Silver
  • Forex
    • AUD
    • Bitcoin
    • CAD
    • CHF
    • Euro
    • GBP
    • INR
    • NZD
    • JPY
  • Raves
  • Consulting
    • Consulting
  • Ramki’s Watchlist
WaveTimes Blog WaveTimes Blog
Home » How we traded Castrol India using Elliott Waves
India

How we traded Castrol India using Elliott Waves

RamkiBy RamkiDecember 9, 2019No Comments3 Mins Read
Facebook Twitter LinkedIn Telegram Pinterest Tumblr Reddit WhatsApp Email
Long term chart
Long term chart
Share
Facebook Twitter LinkedIn Pinterest Email

The following is an abridged version of the most recent trade idea that was shared with the members of the exclusive club of WaveTimes. I present this as one more example you can study and learn from. 

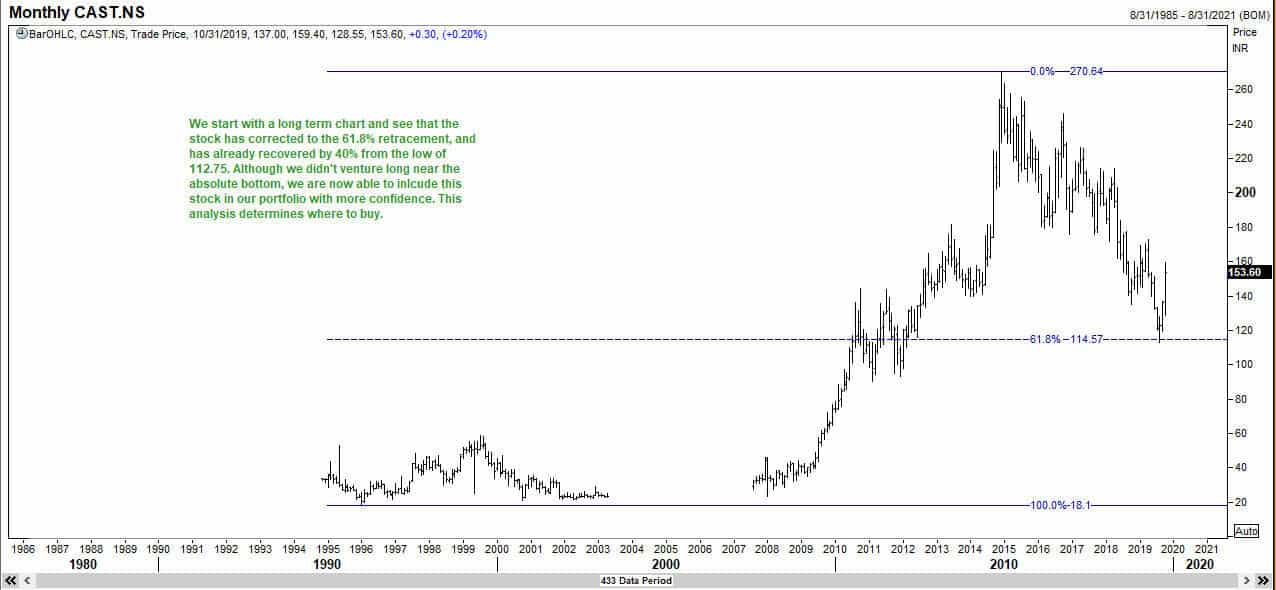
The stock in question is Castrol India and you will now see how I used Elliott Waves to trade the stock profitably. As always, I start with a long term chart, and establish that we could have made a significant low and hence there was a reasonable chance for the stock to reverse into our profit zone. This first chart establishes that. The trade idea posted on 31 October 2019.

Long term chart
Long term chart of Castrol India

I then figure out where to buy. I had to balance between aggression and caution. If I buy too early, I might be faced with a correction that goes deeper than what I would like. 

Deciding where to buy

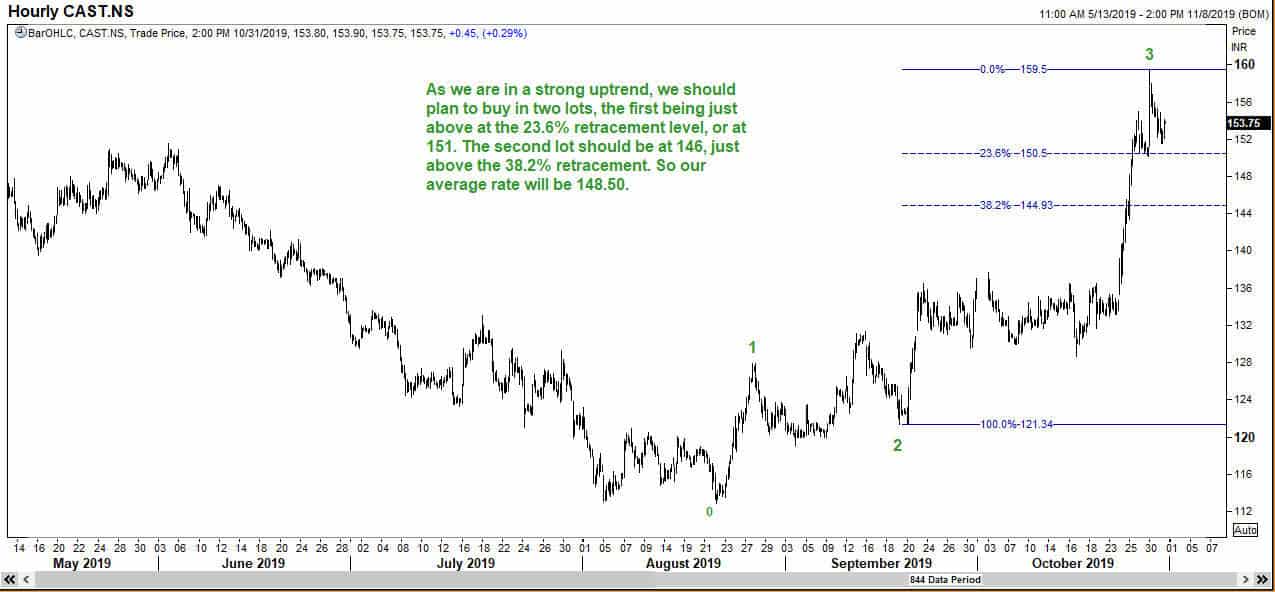
At this time, I considered to place my stop below 144, but this was changed later, as you will see.

The stock dipped below 151 on 4 November, and we were long one lot, and looking to add further down.
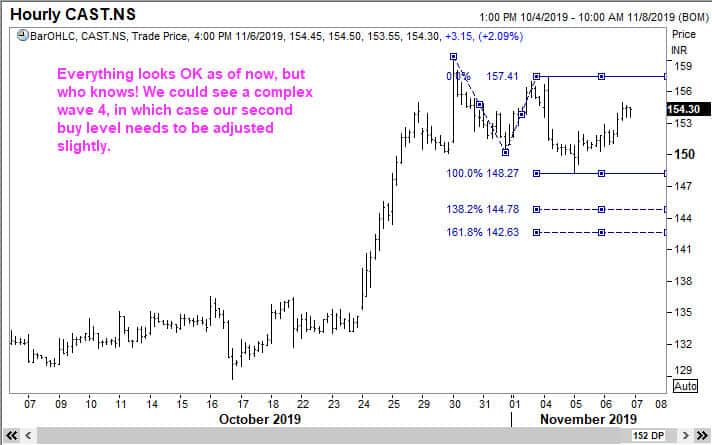
6 November 2019

As you can see from the above, I make no pretense of knowing the future. At WaveTimes, the goal is not making predictions, but to take sensible, low-risk trades that give us out sized rewards for the risk we take.

As the price action developed, it became clear that the correction is becoming more devious than what I would have liked. So I asked my members to delay buying until I finally posted this chart for their consideration on 15 November 2019. We decided to place our order to buy the second lot at 142.80.

Deciding where to buy the second lot

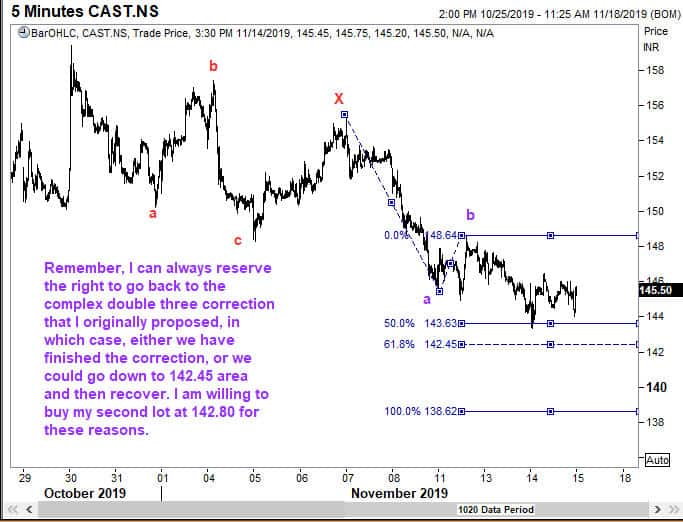
As luck would have it, (or perhaps some of my members became aggressive and placed their buy order for large quantities just ahead of the recommended level), the low seen was 142.95 and the stock closed at 144.55. The following day the stock jumped by over 7%. So we had missed the second buy level by a mere 15 paise. 

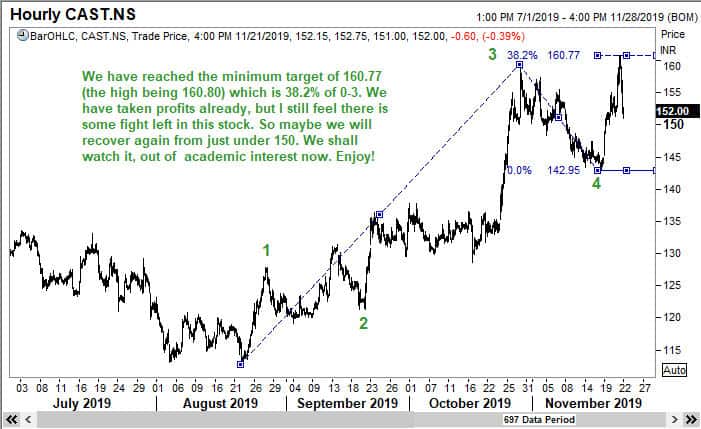
I finally recommended that my members should take profits on the one lot that they had at 159.70, ahead of the nearest target of 160.70. I was about to go away on a 10-day trip and didn’t want my members to miss taking profits. These same players who bought ahead of our buy level of 142.80 could end up selling ahead of the perfect level too! But the stock managed to reach 160.70, from where it came sharply lower! 

We took profits in a timely fashion

If you check the price now, you will see that it has dipped to around 132.50 from 160.70. The secret to successful trading is knowing which battles to participate in! We don’t need to be there all the time.  And a few good trades can do our bottom line a world of good. I teach all this in my online program at https://elliottwaves.com . There is a special festival offer of a 50% discount which you should consider. Best wishes to all my readers.

Using Elliott Wave Analysis
Share. Facebook Twitter Pinterest LinkedIn Tumblr Telegram Email
Previous ArticleTrading General Electric Company using Elliott Waves
Next Article Choosing your battles using Elliott Waves
Ramki
  • Website

Related Posts

How Elliott Waves helped WaveTimes members to exit before the stock market crash

March 27, 2020

Trading Chipotle using Elliott Wave Analysis

December 20, 2015

Nifty rallied up in 5 waves

July 10, 2015
Add A Comment

Leave A Reply Cancel Reply

Recent Posts
  • Has Meta (Facebook) stock seen the bottom
  • What Is The Nearest Technical Support For Meta (NASDAQ: FB)
  • Using Elliott Waves to Capture a Trade in S&P500
  • Hedge Funds and Elliott Waves – Netflix $NFLX
  • When Elliott Waves applauds the promoter’s signals!

WaveTimes is a Research Organization dedicated to providing original analysis, reports, reviews, and insights on developments in mutual funds, stocks, investing, foreign exchange, commodities, and bonds.

Contact WaveTimes

L-601 Mantri Espana,

Kariyammana Agrahara, Bellandur, Bangalore 560103

Follow Us

  • Facebook
  • YouTube
  • Twitter

© 2023 Wave Times. All Rights Reserved.
  • About
  • Books
  • Privacy Policy
  • Policies and Standards

Type above and press Enter to search. Press Esc to cancel.