If you Silver trader, then you might have wondered how to incorporate the use of Fibonacci tools in your trading . This article will show you some simple but effect ways of using Fibonacci in Silver trading.
First, get the big picture Fibonacci retracements in place
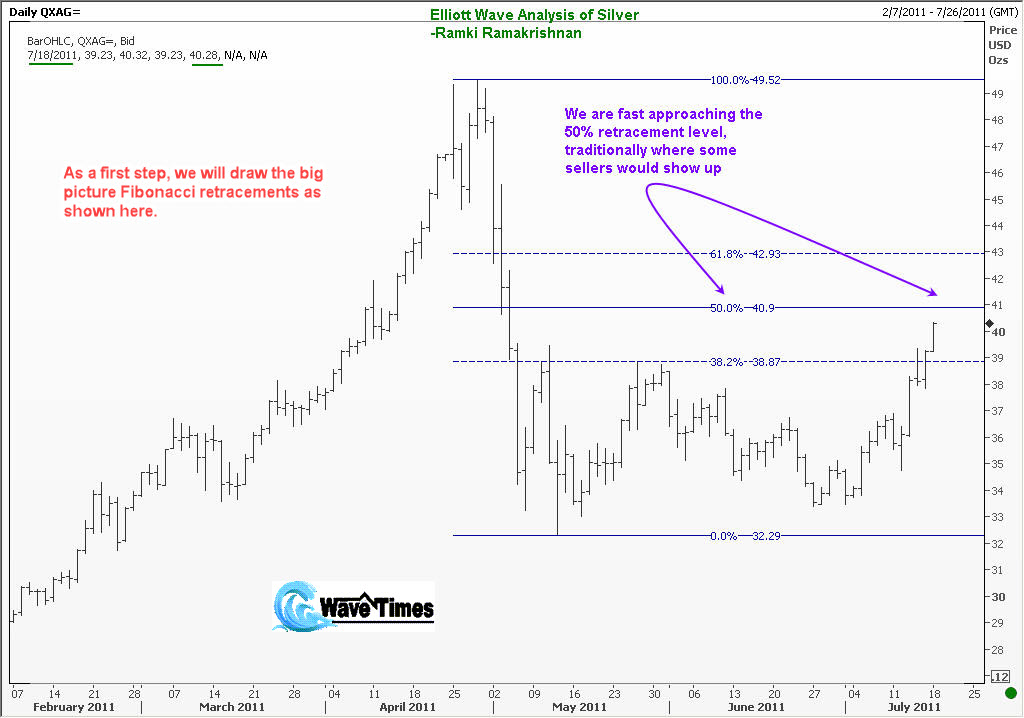
When you are trading silver, I recommend that you take a daily chart and look at the big picture first. This will give you a rough idea of where we are in the Elliott Wave cycle. True, at this point in time, everything is tentative. But you must start somewhere, right? In the daily chart of Silver below, I have captured the price action between 7 February and 26 July. This range is also displayed in the top right corner of the chart.
You can see the date of the screen capture being 18 July. Remember, these dates are not important in what I am trying to teach you. You could be looking at this article 10 years hence, or even 50 years later! But the idea will not change.
Then, using the Fibonacci retracement tool in your charting software, connect the highest high and lowest low. You will get the display of the standard Fibonacci retracement ratios of 38.2%. 50% and 61.8%. In the case of Silver, you can see the current price is 40.28. This is the underlined value for CLOSING PRICE at the top left of the chart. (Remember the four values after the date stand for OHLC, or OPEN, HIGH, LOW and CLOSE).
But more importantly, we are approaching the 50% Fibonacci retracement level of 40.90. As the price is on an upward swing, you will come to the initial conclusion that it is very likely that Silver will approach this Fibonacci level, and our trading effort will be geared with that price target in mind.
Try to see if smaller wave Fibonacci relationships support your initial assessment
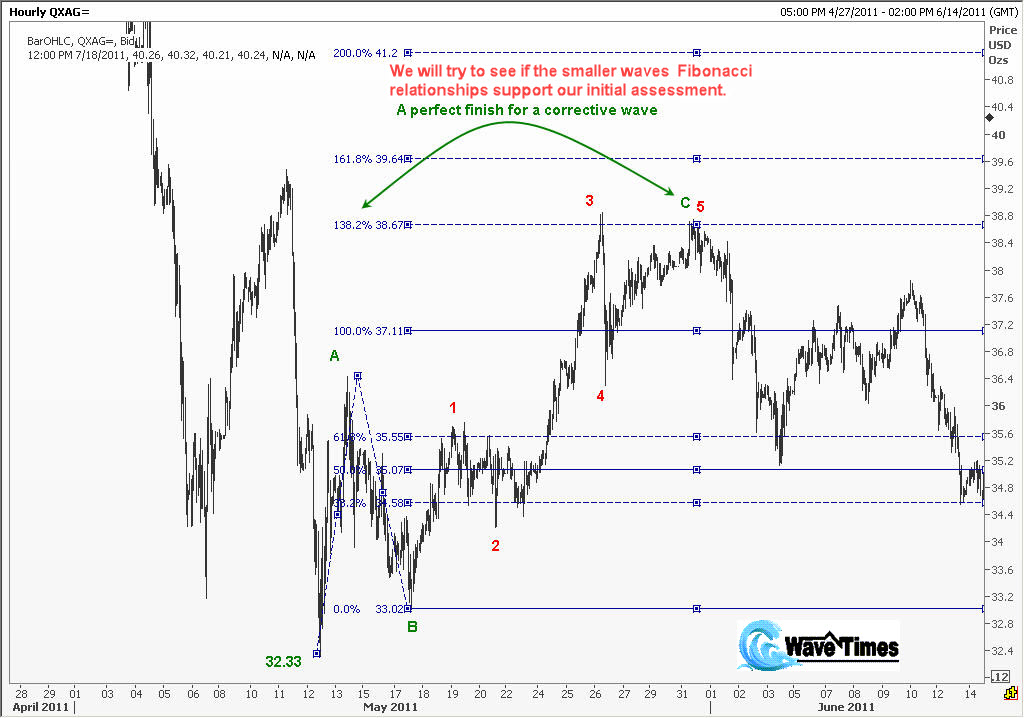
We now examine the rally off the 32.33 low and see if the smaller wave Fibonacci relationships support our initial assessment that we are still in a correction. Look at the chart below where I have presented the first three-wave rally. Here, you will see how Wave C was related to Wave A by the Fibonacci ratio of 138.2%. This adds to our confidence that our initial assessment is likely to be correct. You will remember from the Elliott Wave guidelines that corrections tend to be in three waves, or combination of three-wave patterns. In the present case, notice that sub wave 5 inside wave C is a failed fifth wave, and that means we are likely to get a deep sell off!
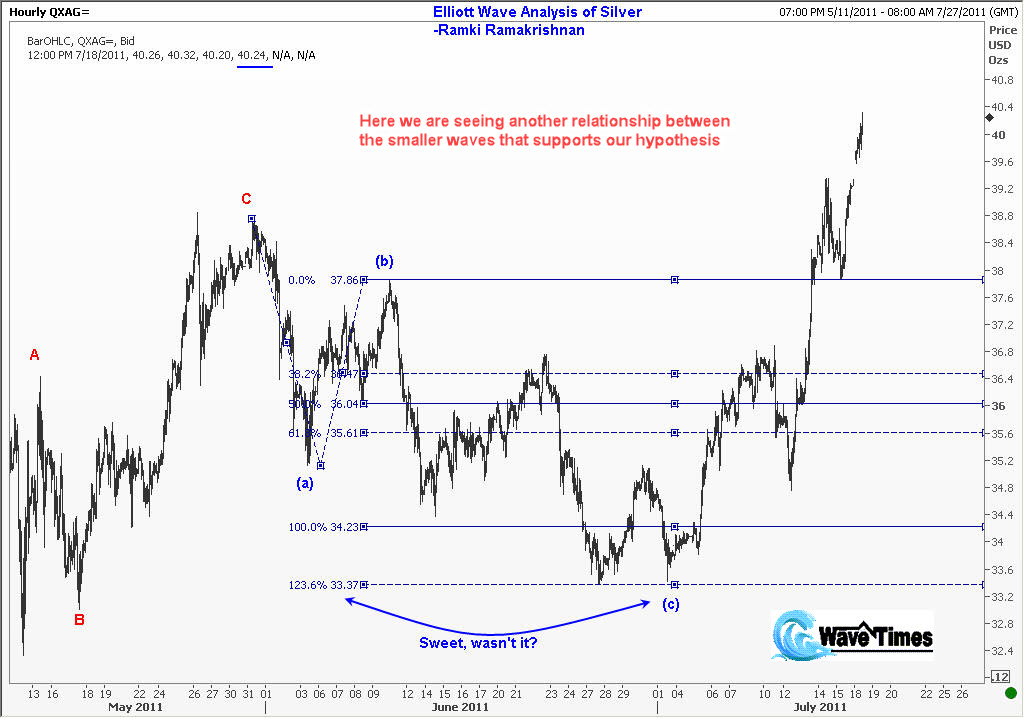
In the next chart, we get another supporting clue that the smaller wave Fibonacci relationships are confirming we are in the right path. Observe that the wave B that developed after the initial three-step wave A, is also in three waves, and the third sub wave is again related to the first sub wave by a ratio of 123.6%.
Drawing our inferences
Now that we have satisfied ourselves that our initial thoughts are well supported by Fibonacci relationships between smaller waves, we draw our inferences. Remember that in the first chart above, we looked at the big picture and saw that we are likely to reach the 50% retracement? We can now confidently conclude that the current upswing in Silver will take it to that price target between 40.39 and 40.70. The initial objective is stated to be 40.39 because that is a 161.8% Fibonacci extension target for the third wave in the current five-wave rally. We should generally not be very deterministic about targets during third waves as it could overshoot. That is why we allow for a further slippage on the upside.
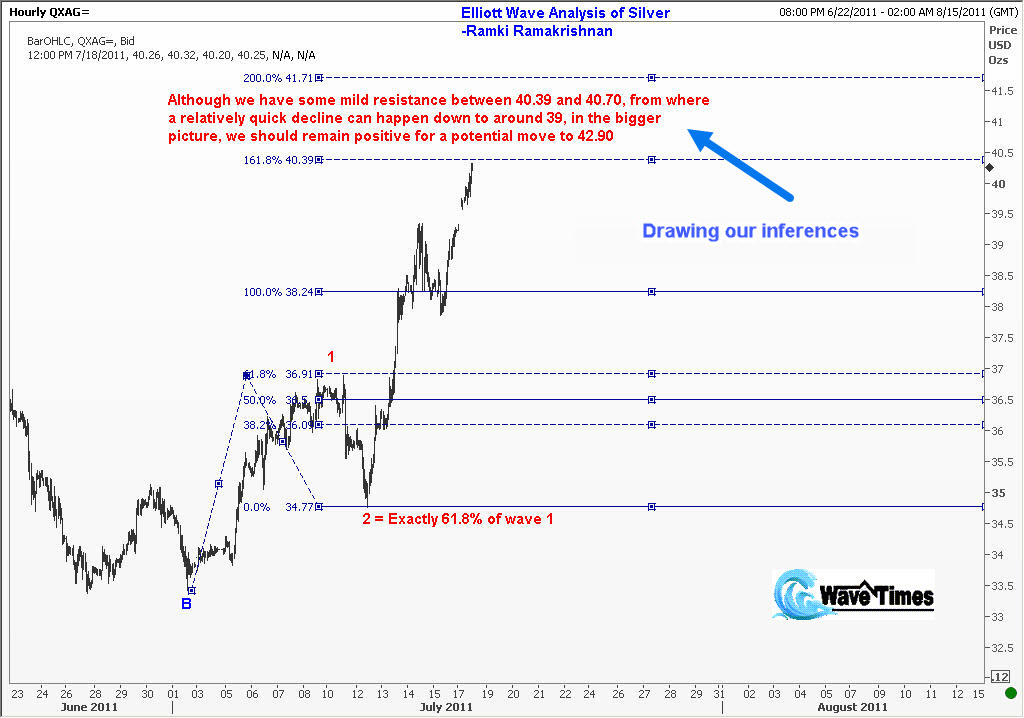
As you will see from the comments in the silver chart above, we do expect a correction down from the 40.39-40.70 window, but remember that will only be a sub wave 4 down. This means we will get one more rally as sub wave 5 to complete the current five-waves of the larger Wave C, and that up move could well take Silver as high as around 42.90.
Final thoughts
In this article we have discussed in detail about how to use Fibonacci in trading the commodity, Silver. There were three steps that has been explained with the help of charts.
First, we look at the big picture Fibonacci retracements to understand where we are in the Elliott Wave cycle. Secondly, we try to see if the smaller wave Fibonacci relationships support our initial assessment. You should bear in mind that the wave pattern is more important than Fibonacci relationships. Once we see that our hypothesis is supported by these Fibonacci relationships, we go to the third step of drawing our conclusions.
Then comes the vital points of how to plan and execute our trade. These steps will be covered in another helpful article. You may consider joining my signature on-line program, “How to Profit from Elliott Waves” where you will learn all the nuances of implementing what you learn here, and from my Elliott Wave books.
