• About
  • Elliott Waves
    • Elliott Waves Explained
    • Elliott Wave Magic Illustrated with Wave Charts
    • Elliott Wave Edge – How Elliott Wave Traders Win
    • Fibonacci Number Series and Elliott Waves
    • How to use Fibonacci Ratio Retracements
    • Elliott Wave Books
      • The Elliott Wave Book – Five Waves to Financial Freedom
      • Dividend Growth Investing Using Elliott Waves
    • Videos
  • Equities
    • Indices
      • Africa
        • Egypt
      • Australia
      • European Indices
        • AEX – Index, Amsterdam
        • DAX Index
        • Istanbul
        • Russia
        • Spain’s IBEX 35
      • Asian Indices
        • India
        • China
        • Dubai
        • Kuwait
        • Kuala Lumpur
        • Pakistan
        • Saudi
        • Taiwan
      • US Indices
        • S&P500
        • Nasdaq
        • Dow Jones
        • Dow Jones Utilities
    • Stocks
      • Asian Stocks
        • Indian Stocks Trading
        • Dubai Stocks Outlook
        • Japanese Stocks
        • Kuwait stocks
        • Saudi Stocks Outlook
      • African Stocks
        • Egyptian Stocks
      • Swiss Stocks
      • Australian Stocks
      • European Stocks
      • US Stocks outlook
      • UK Stocks
  • Commodities
    • Copper
    • Gasoline
    • Gold
    • Natural Gas
    • Oil
    • Palm Oil
    • Raw Sugar
    • Rubber
    • Soybean Oil
    • Silver
  • Forex
    • AUD
    • Bitcoin
    • CAD
    • CHF
    • Euro
    • GBP
    • INR
    • NZD
    • JPY
  • Raves
  • Consulting
    • Consulting
  • Ramki’s Watchlist
Top News

Has Meta (Facebook) stock seen the bottom

March 21, 2022

What Is The Nearest Technical Support For Meta (NASDAQ: FB)

February 7, 2022

Using Elliott Waves to Capture a Trade in S&P500

January 27, 2022
Facebook Twitter Instagram
WaveTimes Blog WaveTimes Blog
Wave times
  • About
  • Elliott Waves
    • Elliott Waves Explained
    • Elliott Wave Magic Illustrated with Wave Charts
    • Elliott Wave Edge – How Elliott Wave Traders Win
    • Fibonacci Number Series and Elliott Waves
    • How to use Fibonacci Ratio Retracements
    • Elliott Wave Books
      • The Elliott Wave Book – Five Waves to Financial Freedom
      • Dividend Growth Investing Using Elliott Waves
    • Videos
  • Equities
    • Indices
      • Africa
        • Egypt
      • Australia
      • European Indices
        • AEX – Index, Amsterdam
        • DAX Index
        • Istanbul
        • Russia
        • Spain’s IBEX 35
      • Asian Indices
        • India
        • China
        • Dubai
        • Kuwait
        • Kuala Lumpur
        • Pakistan
        • Saudi
        • Taiwan
      • US Indices
        • S&P500
        • Nasdaq
        • Dow Jones
        • Dow Jones Utilities
    • Stocks
      • Asian Stocks
        • Indian Stocks Trading
        • Dubai Stocks Outlook
        • Japanese Stocks
        • Kuwait stocks
        • Saudi Stocks Outlook
      • African Stocks
        • Egyptian Stocks
      • Swiss Stocks
      • Australian Stocks
      • European Stocks
      • US Stocks outlook
      • UK Stocks
  • Commodities
    • Copper
    • Gasoline
    • Gold
    • Natural Gas
    • Oil
    • Palm Oil
    • Raw Sugar
    • Rubber
    • Soybean Oil
    • Silver
  • Forex
    • AUD
    • Bitcoin
    • CAD
    • CHF
    • Euro
    • GBP
    • INR
    • NZD
    • JPY
  • Raves
  • Consulting
    • Consulting
  • Ramki’s Watchlist
WaveTimes Blog WaveTimes Blog
Home » How to trade using Elliott Waves
Indian Stocks Trading

How to trade using Elliott Waves

RamkiBy RamkiJanuary 29, 201212 Comments2 Mins Read
Facebook Twitter LinkedIn Telegram Pinterest Tumblr Reddit WhatsApp Email
Share
Facebook Twitter LinkedIn Pinterest Email

This post seeks to illustrate how to trade using Elliott Waves. My goal is not to give you a comprehensive answer to this question, but to show you how to deal with a move that is happening.

The Indian markets have been moving nicely higher in recent weeks, and I am getting mildly bullish. One of the stocks that has rallied sharply is ICICI Bank. So we will use that to illustrate here.

There are three charts presented. The first two charts of ICICI Bank suggest that we have finished a five wave move, and therefore a correction back to the prior fourth wave level (or a 50% pull back) is possible. The third chart offers a more positive view of the market and says hey, maybe we have just finished an extended third. Take a look.
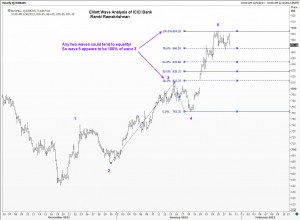
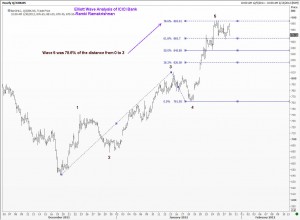
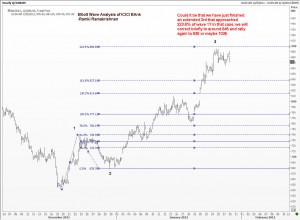

So what is the best strategy now? Once we correct the 5 wave move off the Dec 2011 low, we should get a very fast rally. In order to capture that, we need to be positioned long at suitable levels. INitial supports lie at 844, but a 50% correction from current top comes at 768, which is almost 10% lower. Can we afford such a big downswing? Suppose we buy at 845 and look to add at 770, will that be a better idea? What should we do if it just keeps going down and the Nifty collapses? Can we afford to hold on to this investment? Where should we get out? These are questions that only you can answer as it depends on your investment horizon and risk appetite. You should also be aware that ICICI BAnk will announce its Q3 2012 earnings on 31 Jan 2012 (tomorrow) at 9.30!

ICICI Bank
Share. Facebook Twitter Pinterest LinkedIn Tumblr Telegram Email
Previous ArticleElliott Wave Analysis of S&P 500
Next Article Elliott Wave update for New Zealand Dollar
Ramki
  • Website

Related Posts

When Elliott Waves applauds the promoter’s signals!

January 3, 2022

A soft quarter for TCS – Avoid or Add – Contd.

October 13, 2021

A soft quarter for TCS — Avoid or add?

October 12, 2021
View 12 Comments

12 Comments

  1. RamV on January 30, 2012 7:22 am

    Thanks for the post. BTW, this the same dilemma in NIFTY and BANKNIFTY charts too…

    IMHO, This issue we will face often at the right most part of the chart… It could be ABC wave or 1-2-3-4-5 wave. We have to wait and see for it to unfold…

    In this case, I believe it is 1-2-3-4-5. If I am correct, then we completed extended wave 3. So, the wave 4 is likely to end at 23.6% of 0-3 Wave amplitude. This will be ~ at 835.

    So, my plan is have a stop loss at 830. If, I am correct, then S/L wouldn’t get hit and I can continue with my long. If I am wrong, I will get stopped out. Good for me 🙂 and I will wait on sidelines for the wave pattern to emerge.

    –RamV

    Reply
  2. manu on February 2, 2012 11:23 pm

    sir, very confusing..
    is extended 3rd finished ?
    then 4th on or it looks a triangle?

    difficult

    Reply
    • Ramki on February 13, 2012 3:51 am

      Manu, it is not possible to state in the middle of a move whether it is finished or not. I do see the Nifty going to 5500 but cannot say whether we will see a correction enroute. Unfortunately, I am not in a postion to track the moves every day and in every step! Good luck.

      Reply
      • manu on February 17, 2012 12:34 am

        its 5600..is it 5th ?

        Reply
        • Ramki on February 17, 2012 7:44 am

          Hi Manu, Nifty is at 5600. I think we will see some good offers at 5650

          Reply
  3. pushyamitra tiwari on February 3, 2012 1:42 am

    whats your view on sterlite industries .
    metal sector

    Reply
    • Ramki on February 13, 2012 3:52 am

      HI Pushyamitra, aplogies, but given my full time job I am unable to offer views/counts on everything that my friends request. Hope you understand!

      Reply
  4. Roshan on February 3, 2012 6:58 pm

    Just brought the book on the basis of the reviews on Amazon. The book is good and it really simplifies the Elliott wave theory.

    Reply
  5. S.Billa on February 6, 2012 6:52 am

    Mr.Ramki,
    In this example as time moves, the wave3 may turn into extended Wave3 or may finish the cycle wave4 and wave5. My confusion is, how many bars(days) need to count in wave cycle if I’m trading bi-weekly or monthly timeframe, What are the min or max daily bars need to count in wave cycles monthly trades? Can you share your inputs please?

    Reply
    • Ramki on February 7, 2012 5:45 am

      Hello Billa, Thank you for your comments. I wonder if you have read my book, because this is all covered there. You cannot be sure where an extension will end. And certainly you cannot count the bars to determine where any wave will finsih. You can anticipate a wave reaching a certain level, and then decide what to do at that point, depending on the speed with which it reached there, and what are the internal waves of the move.

      Reply
  6. manu on February 20, 2012 10:13 pm

    thnx sir..

    in present case ..hw will we determine its a correctiv or a new bull market?
    if i take count from march 2009 frm nifty ..it looks correctiv
    if i take count from jan 2008..it looks correctv

    and if i take from sep 2003 it looks new bull market

    Reply
    • Ramki on February 22, 2012 1:36 am

      Manu, if you keep going back in time you and see a bigger and bigger degree, you are apt to get confused. In my book I have explained that you should start your count from a nearby significant low in order to keep your perspective right. If you are a trader, then that is all you need.

      Reply

Leave A Reply Cancel Reply

Recent Posts
  • Has Meta (Facebook) stock seen the bottom
  • What Is The Nearest Technical Support For Meta (NASDAQ: FB)
  • Using Elliott Waves to Capture a Trade in S&P500
  • Hedge Funds and Elliott Waves – Netflix $NFLX
  • When Elliott Waves applauds the promoter’s signals!

WaveTimes is a Research Organization dedicated to providing original analysis, reports, reviews, and insights on developments in mutual funds, stocks, investing, foreign exchange, commodities, and bonds.

Contact WaveTimes

L-601 Mantri Espana,

Kariyammana Agrahara, Bellandur, Bangalore 560103

Follow Us

  • Facebook
  • YouTube
  • Twitter

© 2023 Wave Times. All Rights Reserved.
  • About
  • Books
  • Privacy Policy
  • Policies and Standards

Type above and press Enter to search. Press Esc to cancel.