• About
  • Elliott Waves
    • Elliott Waves Explained
    • Elliott Wave Magic Illustrated with Wave Charts
    • Elliott Wave Edge – How Elliott Wave Traders Win
    • Fibonacci Number Series and Elliott Waves
    • How to use Fibonacci Ratio Retracements
    • Elliott Wave Books
      • The Elliott Wave Book – Five Waves to Financial Freedom
      • Dividend Growth Investing Using Elliott Waves
    • Videos
  • Equities
    • Indices
      • Africa
        • Egypt
      • Australia
      • European Indices
        • AEX – Index, Amsterdam
        • DAX Index
        • Istanbul
        • Russia
        • Spain’s IBEX 35
      • Asian Indices
        • India
        • China
        • Dubai
        • Kuwait
        • Kuala Lumpur
        • Pakistan
        • Saudi
        • Taiwan
      • US Indices
        • S&P500
        • Nasdaq
        • Dow Jones
        • Dow Jones Utilities
    • Stocks
      • Asian Stocks
        • Indian Stocks Trading
        • Dubai Stocks Outlook
        • Japanese Stocks
        • Kuwait stocks
        • Saudi Stocks Outlook
      • African Stocks
        • Egyptian Stocks
      • Swiss Stocks
      • Australian Stocks
      • European Stocks
      • US Stocks outlook
      • UK Stocks
  • Commodities
    • Copper
    • Gasoline
    • Gold
    • Natural Gas
    • Oil
    • Palm Oil
    • Raw Sugar
    • Rubber
    • Soybean Oil
    • Silver
  • Forex
    • AUD
    • Bitcoin
    • CAD
    • CHF
    • Euro
    • GBP
    • INR
    • NZD
    • JPY
  • Raves
  • Consulting
    • Consulting
  • Ramki’s Watchlist
Top News

Has Meta (Facebook) stock seen the bottom

March 21, 2022

What Is The Nearest Technical Support For Meta (NASDAQ: FB)

February 7, 2022

Using Elliott Waves to Capture a Trade in S&P500

January 27, 2022
Facebook Twitter Instagram
WaveTimes Blog WaveTimes Blog
Wave times
  • About
  • Elliott Waves
    • Elliott Waves Explained
    • Elliott Wave Magic Illustrated with Wave Charts
    • Elliott Wave Edge – How Elliott Wave Traders Win
    • Fibonacci Number Series and Elliott Waves
    • How to use Fibonacci Ratio Retracements
    • Elliott Wave Books
      • The Elliott Wave Book – Five Waves to Financial Freedom
      • Dividend Growth Investing Using Elliott Waves
    • Videos
  • Equities
    • Indices
      • Africa
        • Egypt
      • Australia
      • European Indices
        • AEX – Index, Amsterdam
        • DAX Index
        • Istanbul
        • Russia
        • Spain’s IBEX 35
      • Asian Indices
        • India
        • China
        • Dubai
        • Kuwait
        • Kuala Lumpur
        • Pakistan
        • Saudi
        • Taiwan
      • US Indices
        • S&P500
        • Nasdaq
        • Dow Jones
        • Dow Jones Utilities
    • Stocks
      • Asian Stocks
        • Indian Stocks Trading
        • Dubai Stocks Outlook
        • Japanese Stocks
        • Kuwait stocks
        • Saudi Stocks Outlook
      • African Stocks
        • Egyptian Stocks
      • Swiss Stocks
      • Australian Stocks
      • European Stocks
      • US Stocks outlook
      • UK Stocks
  • Commodities
    • Copper
    • Gasoline
    • Gold
    • Natural Gas
    • Oil
    • Palm Oil
    • Raw Sugar
    • Rubber
    • Soybean Oil
    • Silver
  • Forex
    • AUD
    • Bitcoin
    • CAD
    • CHF
    • Euro
    • GBP
    • INR
    • NZD
    • JPY
  • Raves
  • Consulting
    • Consulting
  • Ramki’s Watchlist
WaveTimes Blog WaveTimes Blog
Home » How should we trade the Nifty using Elliott Waves
Indian Stocks Trading

How should we trade the Nifty using Elliott Waves

RamkiBy RamkiNovember 5, 20186 Comments1 Min Read
Facebook Twitter LinkedIn Telegram Pinterest Tumblr Reddit WhatsApp Email
Share
Facebook Twitter LinkedIn Pinterest Email

In the upcoming Elliott Wave workshop at Bangalore, we will deal with specific examples such as the following.

Headlines from Moneycontrol.com website


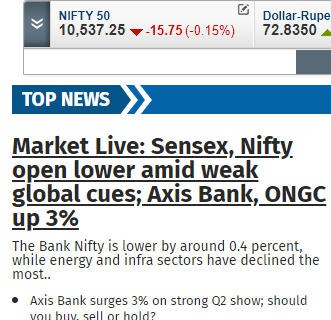
Today, the Nifty index has opened slightly lower. You have already listened to a whole bunch of market experts on CNBC, and are none the wiser for it! Truth be told, success comes when you know how to trade. What is your own outlook? What is your edge? What is your strategy? These are some of the questions we will deal with.

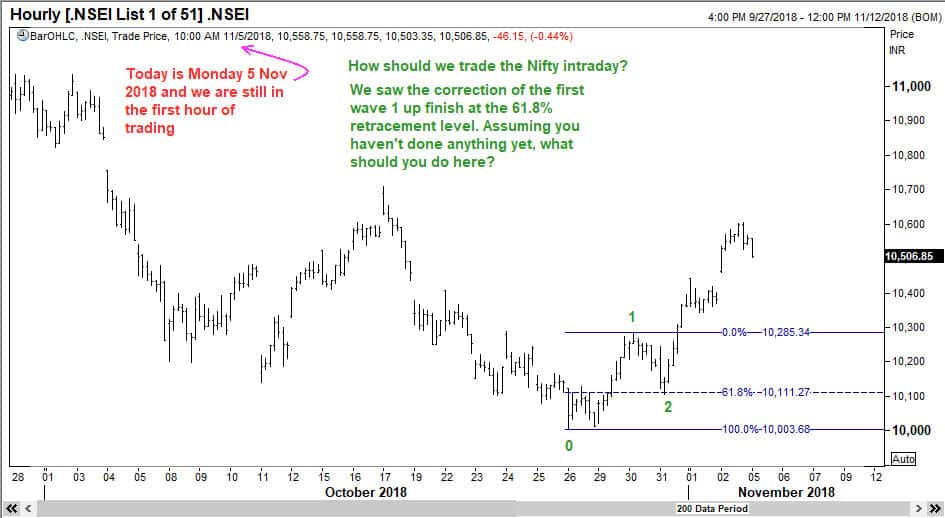
Take a look at these two charts, and you will see stuff that almost anyone can figure out.

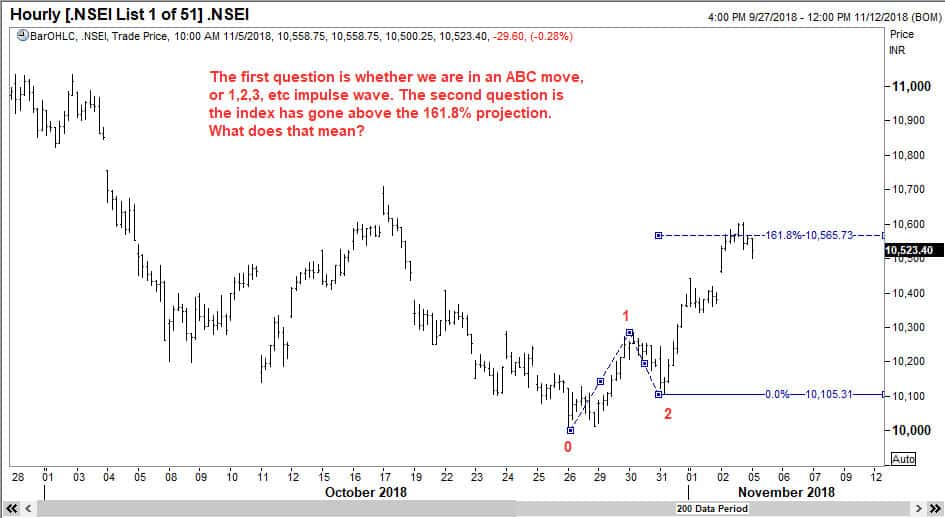
What next? This is what we will address at the workshop.


Elliott Wave Workshop
Share. Facebook Twitter Pinterest LinkedIn Tumblr Telegram Email
Previous ArticleA sneak preview of an example from the Elliott Wave Workshop
Next Article How to use Elliott Waves Bank Nifty Expiration Example
Ramki
  • Website

Related Posts

When Elliott Waves applauds the promoter’s signals!

January 3, 2022

A soft quarter for TCS – Avoid or Add – Contd.

October 13, 2021

A soft quarter for TCS — Avoid or add?

October 12, 2021
View 6 Comments

6 Comments

  1. JAGADEESH on November 23, 2018 7:19 am

    Dear Ramki,

    Looking at elliot wave count of nifty, it appears that current move seen is only XX wave completed as five (abcde) wave structure at 10774.50. Current move from 10774.50 to 10512 is wave a of new corrective wave.

    Reply
    • Ramki Ramakrishnan on January 1, 2019 11:42 am

      Jagaseesh, My recommendation will be to be faithful to your own count while trading! Only then will you know when to exit.

      Reply
  2. sanjeev anand on January 8, 2019 8:00 pm

    hi ramki, i have one confusion if monthly chart shows down trend and daily chart shows up trend then which way should i tread ? please tell me . and one more thing for 5- 10- days treading what time frame i should choose for analysis? thanks, a lot.

    Reply
    • Ramki Ramakrishnan on February 7, 2019 5:02 pm

      Sanjeev, The choice of the time frame depends on your investment objective and style. If you are a long term investor, then the short term trends will only be used for confirmation of where to exit your portfolio or add to it. If you are a trader, then the monthly charts are more of guidance, but the real meat of the analysis will be in the daily charts.

      Reply
  3. Pratik Chowdhury on March 15, 2019 9:18 am

    Hello Ramki sir

    I want to ask that whilst using the elliot wave what time frame should be used by an intraday trader ?

    Reply
    • Ramki Ramakrishnan on April 16, 2019 5:22 am

      Pratik, My first preference would always be the daily chart, followed by the hourly chart. After that, merely to validate your entry levels, you can go down the time frame to 5 minutes

      Reply

Leave A Reply Cancel Reply

Recent Posts
  • Has Meta (Facebook) stock seen the bottom
  • What Is The Nearest Technical Support For Meta (NASDAQ: FB)
  • Using Elliott Waves to Capture a Trade in S&P500
  • Hedge Funds and Elliott Waves – Netflix $NFLX
  • When Elliott Waves applauds the promoter’s signals!

WaveTimes is a Research Organization dedicated to providing original analysis, reports, reviews, and insights on developments in mutual funds, stocks, investing, foreign exchange, commodities, and bonds.

Contact WaveTimes

L-601 Mantri Espana,

Kariyammana Agrahara, Bellandur, Bangalore 560103

Follow Us

  • Facebook
  • YouTube
  • Twitter

© 2022 Wave Times. All Rights Reserved.
  • About
  • Books
  • Privacy Policy
  • Policies and Standards

Type above and press Enter to search. Press Esc to cancel.