• About
  • Elliott Waves
    • Elliott Waves Explained
    • Elliott Wave Magic Illustrated with Wave Charts
    • Elliott Wave Edge – How Elliott Wave Traders Win
    • Fibonacci Number Series and Elliott Waves
    • How to use Fibonacci Ratio Retracements
    • Elliott Wave Books
      • The Elliott Wave Book – Five Waves to Financial Freedom
      • Dividend Growth Investing Using Elliott Waves
    • Videos
  • Equities
    • Indices
      • Africa
        • Egypt
      • Australia
      • European Indices
        • AEX – Index, Amsterdam
        • DAX Index
        • Istanbul
        • Russia
        • Spain’s IBEX 35
      • Asian Indices
        • India
        • China
        • Dubai
        • Kuwait
        • Kuala Lumpur
        • Pakistan
        • Saudi
        • Taiwan
      • US Indices
        • S&P500
        • Nasdaq
        • Dow Jones
        • Dow Jones Utilities
    • Stocks
      • Asian Stocks
        • Indian Stocks Trading
        • Dubai Stocks Outlook
        • Japanese Stocks
        • Kuwait stocks
        • Saudi Stocks Outlook
      • African Stocks
        • Egyptian Stocks
      • Swiss Stocks
      • Australian Stocks
      • European Stocks
      • US Stocks outlook
      • UK Stocks
  • Commodities
    • Copper
    • Gasoline
    • Gold
    • Natural Gas
    • Oil
    • Palm Oil
    • Raw Sugar
    • Rubber
    • Soybean Oil
    • Silver
  • Forex
    • AUD
    • Bitcoin
    • CAD
    • CHF
    • Euro
    • GBP
    • INR
    • NZD
    • JPY
  • Raves
  • Consulting
    • Consulting
  • Ramki’s Watchlist
Top News

Has Meta (Facebook) stock seen the bottom

March 21, 2022

What Is The Nearest Technical Support For Meta (NASDAQ: FB)

February 7, 2022

Using Elliott Waves to Capture a Trade in S&P500

January 27, 2022
Facebook Twitter Instagram
WaveTimes Blog WaveTimes Blog
Wave times
  • About
  • Elliott Waves
    • Elliott Waves Explained
    • Elliott Wave Magic Illustrated with Wave Charts
    • Elliott Wave Edge – How Elliott Wave Traders Win
    • Fibonacci Number Series and Elliott Waves
    • How to use Fibonacci Ratio Retracements
    • Elliott Wave Books
      • The Elliott Wave Book – Five Waves to Financial Freedom
      • Dividend Growth Investing Using Elliott Waves
    • Videos
  • Equities
    • Indices
      • Africa
        • Egypt
      • Australia
      • European Indices
        • AEX – Index, Amsterdam
        • DAX Index
        • Istanbul
        • Russia
        • Spain’s IBEX 35
      • Asian Indices
        • India
        • China
        • Dubai
        • Kuwait
        • Kuala Lumpur
        • Pakistan
        • Saudi
        • Taiwan
      • US Indices
        • S&P500
        • Nasdaq
        • Dow Jones
        • Dow Jones Utilities
    • Stocks
      • Asian Stocks
        • Indian Stocks Trading
        • Dubai Stocks Outlook
        • Japanese Stocks
        • Kuwait stocks
        • Saudi Stocks Outlook
      • African Stocks
        • Egyptian Stocks
      • Swiss Stocks
      • Australian Stocks
      • European Stocks
      • US Stocks outlook
      • UK Stocks
  • Commodities
    • Copper
    • Gasoline
    • Gold
    • Natural Gas
    • Oil
    • Palm Oil
    • Raw Sugar
    • Rubber
    • Soybean Oil
    • Silver
  • Forex
    • AUD
    • Bitcoin
    • CAD
    • CHF
    • Euro
    • GBP
    • INR
    • NZD
    • JPY
  • Raves
  • Consulting
    • Consulting
  • Ramki’s Watchlist
WaveTimes Blog WaveTimes Blog
Home » How market clues tie up with Elliott Waves
India

How market clues tie up with Elliott Waves

RamkiBy RamkiJuly 31, 201426 Comments4 Mins Read
Facebook Twitter LinkedIn Telegram Pinterest Tumblr Reddit WhatsApp Email
Share
Facebook Twitter LinkedIn Pinterest Email

Many traders blindly trade without paying attention to the market clues that tie up with Elliott Wave. This article discusses some strategies.

This morning, I saw a news item that went as follows “South African telecom firm MTN is keen to enter the Indian shores. CNBC-TV18 learns from sources that MTN may go for a strategic acquisition route for its India entry. Interestingly, a lot of buzz was created on Twitter after Harsh Goenka, chairman of tyres-to-software conglomerate RPG Enterprises tweeted from his handle @hvgoenka: “MTN doing due diligence of a large Mumbai-based telecom company. Will this mega deal happen?” He, however, did not answer the subsequent questions from Twitteratti. Sources told CNBC-TV18 that MTN is open to picking up financial stake in existing Indian telecom player. They say MTN is in talks with three Indian telcos — Reliance Communications , Tata Teleservices and Idea Cellular . However, Goenka’s nudge could be towards the Anil Ambani-owned Reliance Communications that has twice in the past held talks and even agreed to part with majority stake for management control in one instance.

Read more at: Moneycontrol
So three companies are being mentioned and I looked at all of them, and decided to present some of the charts for you to learn from. As I have often been saying, this blog is to help you learn Elliott Waves. For those who are seeking trade ideas, the place to go is wavetimes.net, but again, that forum is meant for traders and investors who have serious money at risk, and for the experienced traders. If you are already a member of that exclusive club, be sure to add the email wavetimes.member @ gmail.com to your contact list as otherwise my trade ideas and notifications could land in your spam folder.

The following are only some of the charts relating to Idea Cellular Ltd because, of the three companies, I believe this stock is the most likely candidate, even though Mr Goenka thinks it is RCOM (I continue to own shares in RCOM from the time I discussed buying it here at wavetimes.com when it was less than half its current value)

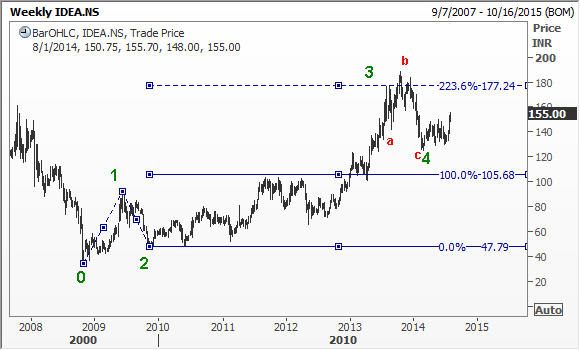
The first chart shows the labels for the wave 1 to wave 4 of Idea Cellular Ltd. This exercise allows you to figure out where we are in the bigger picture for this stock. You can see that wave 3 was extended, having reached 223.6% of wave 1. I suggest right-clicking each image and opening it in a different tab!

Wave 1 to wave 4 of Idea Cellular Ltd

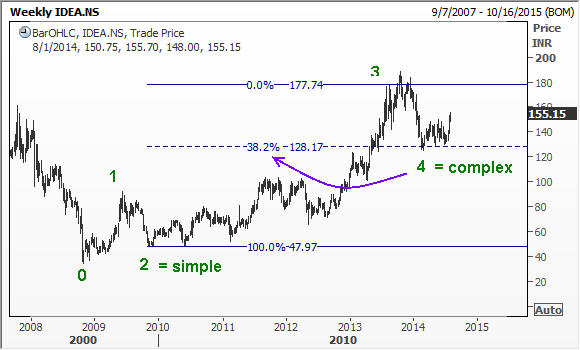
Further examination reveals that wave 4 has come down by 38.2% of wave 3. You will also see the principle of alternation at work. As wave 2 was a simple correction, wave 4 became complex, in the form of an irregular correction.

Wave 2 was simple, so wave 4 was complex
Wave 4 was an irregular correction

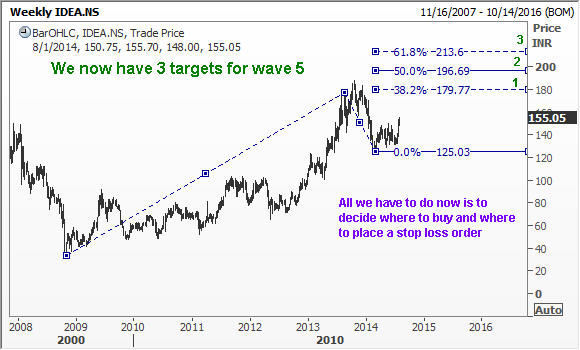
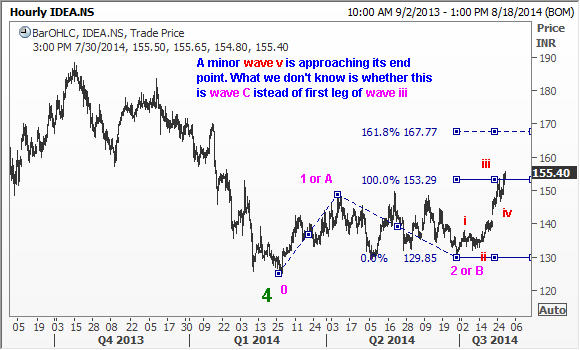
Now that we have satisfied ourselves that wave 4 has been completed, and that we are in wave 5 for Idea Cellular Ltd, we can go about deciding the targets for wave 5. As explained in my book Five Waves to Financial Freedom and elsewhere in this blog, we can usually compute easily three possible targets for wave 5. This is shown in the following chart.

Fifth wave targets for Idea Cellular Ltd

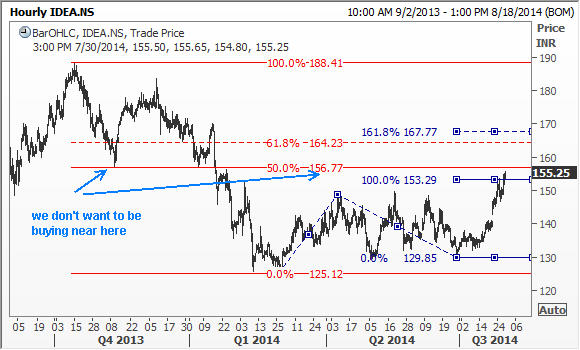
But many beginning traders and analysts fail to pay attention to other clues. For example, being aware of nearby resistances as shown below.

Nearby resistances for Idea Cellular Ltd

And finally, they also fail to take into account the possibility of being wrong. Even with 30 years of doing this stuff, I make allowances for errors, which is why the trades discussed in wavetimes.net are carefully chosen to give us the best chances for success. With Idea Cellular, despite the fact that there are certain additional clues that the MTN stake speculation is pointing in their direction, Elliott Wave analysis warns us to be aware of a different possibility.

Can this be a corrective ABC rally in Idea Cellular Ltd?

Having examined the various sides of the picture, we can now decide whether we should buy, and if yes, where we should buy this stock. And more importantly, where we should place a stop loss. But you can do that yourself, given the vast amount of inputs shared with you over the last so many years on this blog.

Good luck.

Elliott Wave Theory Explained

Elliott Wave clues Idea Cellular Ltd MTN
Share. Facebook Twitter Pinterest LinkedIn Tumblr Telegram Email
Previous ArticleElliott Wave update for Alliant Energy Corporation
Next Article Trading with Elliott Waves
Ramki
  • Website

Related Posts

How Elliott Waves helped WaveTimes members to exit before the stock market crash

March 27, 2020

How we traded Castrol India using Elliott Waves

December 9, 2019

Nifty rallied up in 5 waves

July 10, 2015
View 26 Comments

26 Comments

  1. charanpreet on July 31, 2014 4:08 pm

    Dear sir
    thanks for ur inputs.
    sir what prices you take for analysis.
    close,high low avg, or plotting what came first.

    regards
    a student

    Reply
    • Ramki Ramakrishnan on July 31, 2014 5:16 pm

      Hi Charanpreet, I use the end points of the moves, i.e. the lowsest low in a down move and the highest high in an up move.

      Reply
  2. John302928 on August 1, 2014 1:48 pm

    Dear Ramki,
    It could be a live example of how market clues tie up with Elliott waves. It is very well explained . Thank you.
    Could you please share your views on which method we can adopt to find out which wave is extended in the impulsive waves 1,3,5

    Reply
    • Ramki Ramakrishnan on August 1, 2014 8:58 pm

      John, This is covered adequately in my book, and it is too detailed to explain in a comment

      Reply
  3. M.D.Dharmendra on August 1, 2014 6:03 pm

    Dear Sir,

    How are you and I pray for your good health.

    I am one of your fascinated readers from long time .Thanks for your valuable teachings all these years

    Yesterday I have seen this post and gone short today 161.5 which is 61.8% from wave 4(146.75) and covered in intraday at 156 only thing i traded in 50shares with profit of Rs 250 only

    Thanks for your post.

    Regards,
    M.D.Dharmendra

    Reply
    • Ramki Ramakrishnan on August 1, 2014 8:55 pm

      Dharmendra, Thank you for writing. Just to remind you that this blog is not trading advice! So be careful…all the best

      Reply
  4. dylan on August 3, 2014 10:22 am

    Hi Sir

    my question is regarding R Com

    Rcom seem to have done its 1 wave i.e (set of 5) and is in its 2 wave which is turning out to be a zig zag
    in which A wave is done from (165 to 106.75) B done ( from 106.75 to 157) and the C wave is on from 157
    now i remember you said in the book that a corrective wave “c” can travel up to 100 % or 138.2 % or 161.8% which culminates into 3 targets 98.75, 84.49 & 70.75

    my question is not about targets but it is about the price range from 91 to 98 which had earlier been a resistance for the scrip on three occasions. now i know that earlier resistances turn into supports so can a correction once it crosses 100 % of target it has to extend all the way to 138.2% or it can terminate at any where between the 100 % to 138.2 % range let say correction can be over at an odd number 117 %.

    also once the corrective move is done we would be in a 3rd wave for r.com which would be swiftest and fastest for the scrip

    Reply
    • Ramki Ramakrishnan on August 11, 2014 7:52 pm

      Hi Dylan, The first thing you need to know is that Fibonacci relationships are not cast in stone. They are used by us to establish probable targets, and there could be variations from the usual price objectives. Good luck

      Reply
  5. Dipak on August 3, 2014 2:54 pm

    Hi Ramki sir…I am silent reader of your all posts…I have read your book,it increases my interest in Elliott waves…truly the best book i ever read on Elliott waves…Sir,currently m practicing to count waves.After reading your post on Idea Cellular(Only title),i off the browser screen n start to count waves on my charting application…here http://postimg.org/image/hxv7ipxcf/ ,i have uploaded my image…please correct my errors…

    Reply
    • Ramki Ramakrishnan on August 11, 2014 7:48 pm

      Dipak, I am sorry that there are too many such requests and hence not able to help you with that. All the best.

      Reply
  6. Dipak on August 3, 2014 3:15 pm

    Sir…as a beginner, how can i screen elliott waves candidate?…means what condition should to screen elliott waves candidate on EOD(End of Day) charts…

    Reply
    • Ramki Ramakrishnan on August 11, 2014 7:47 pm

      Dipak, Why do you need to screen for candidates when every well traded instrument seems to be following the Elliott Wave principle!

      Reply
  7. Krish on August 4, 2014 6:32 pm

    Sir, I am new to this blog and found the information very useful. Have a quick question to clarify – May be a very elementary one. In the 1st chart (where the 1st 4 waves are depicted), Why was Point B not considered as end of the wave 3, Instead a lower point was chosen to be end of wave 3. Please share your insights. Thanks.

    Reply
    • Ramki Ramakrishnan on August 11, 2014 7:45 pm

      Krish, thanks for your comments. There is nothing sacred about point B. It is just my interpretation because I felt wave 4 will be a complex correction. It is always the case that at any point in time there will be more than one valid count, and we will not know which is correct until the move is over. So you have to stick to your own count until it is proved wrong.

      Reply
  8. Mahesh on August 5, 2014 6:23 pm

    Hi Ramki,
    This is your longtime fan Mahesh. I have a question regarding alternation. If wave 2 retraced 78.6% then can wave 4 retrace 50%? I have explained my question in the chart here. http://s27.postimg.org/mupzotypv/NTPC_Daily_05_Aug_2014.png

    I also wish to tell you that now I am using alternation as a rule rather than merely a guideline. This helps me in differentiate between impulse and corrective moves better.

    Reply
    • Ramki Ramakrishnan on August 11, 2014 7:41 pm

      Mahesh, Usually when wave 2 is deep, wave 4 will tend to correct between 23% and 38%. But there are guidelines, and treating them as rules is also not recommended.

      Reply
  9. yogesh on August 6, 2014 4:40 pm

    Resp. Ramki Sir,
    Thanks for sharing complex correction. Its always tough to handle this scenario for me. on daily charts of idea its zigzag in 4th wave ended around 125. So thats also good entry point though.

    Its looking like wxyxz on daily chart of idea.. 129.85 is bottom looking like to enter.

    I am learning here. Thanks a lot. Sir

    Reply
  10. sandy on August 14, 2014 10:59 am

    Hi Ramki Sir,
    What is the difference between Elliott wave theory explained by Robert Pittcherf and Neely wave? Are you also following Neely wave concepts? if not, then Do you think to understand each and every concepts of Elliott waves and master it, reading your book is enough rather than going through Neely waves which is complex one?

    Thanks

    Reply
    • Ramki Ramakrishnan on August 14, 2014 8:19 pm

      Hello Sandy, I have read Prechter’s book but not Neely wave. What I have learned and experienced about the original Elliott Wave Principle serves me well enough. If you have a sound understanding of any one approach, that should be good enough to make you a good trader or investor.

      Reply
      • Dipak on August 14, 2014 9:22 pm

        sir,it means there is no shortcut for success………

        Reply
  11. Prabh on September 16, 2014 12:37 pm

    Ramki Sir,

    For IDEA,can you provide us wave count for Wave 3 please on daily timframe.

    Reply
    • Ramki Ramakrishnan on September 17, 2014 7:27 pm

      Prabh, There are numerous examples in this blog as well as in my book.

      Reply
  12. Dylan on January 5, 2015 5:02 pm

    Sir

    My question is regarding Rcom

    It seems a Clear 5th for C wave is done but is it still to do time correction than price correction

    as the up move took 55 weeks the down move is in 67th week 66/55 = 1.218

    the third would be a blast Sir thx for the book

    Reply
  13. sunny arora on April 22, 2015 5:01 pm

    sir, RCOM has corrected significantly and revive approx and around from lows of 2013 when it touched 46 and now it reversed from 56..After analysing both i reached to conclusion that wave 2 always retraces 90% of wave 1 in rcom every time…so can we expect 3rd or c wave in rcom for target 176 or +200 in rcom..i know odds i.e. fundamentals are not favouring Rcom but who cares .elliott wave rocks and you rock ..so please clear deadlock and confusion in my mind..thanks in advance

    Reply
    • Ramki Ramakrishnan on April 22, 2015 10:06 pm

      Sunny, I am personally long RCOM

      Reply
  14. sunny arora on April 23, 2015 6:25 pm

    Sir can’t be a better reply than this for ans of my query..you rocks I wish u become richest man on earth using elwave

    Reply

Leave A Reply Cancel Reply

Recent Posts
  • Has Meta (Facebook) stock seen the bottom
  • What Is The Nearest Technical Support For Meta (NASDAQ: FB)
  • Using Elliott Waves to Capture a Trade in S&P500
  • Hedge Funds and Elliott Waves – Netflix $NFLX
  • When Elliott Waves applauds the promoter’s signals!

WaveTimes is a Research Organization dedicated to providing original analysis, reports, reviews, and insights on developments in mutual funds, stocks, investing, foreign exchange, commodities, and bonds.

Contact WaveTimes

L-601 Mantri Espana,

Kariyammana Agrahara, Bellandur, Bangalore 560103

Follow Us

  • Facebook
  • YouTube
  • Twitter

© 2023 Wave Times. All Rights Reserved.
  • About
  • Books
  • Privacy Policy
  • Policies and Standards

Type above and press Enter to search. Press Esc to cancel.