• About
  • Elliott Waves
    • Elliott Waves Explained
    • Elliott Wave Magic Illustrated with Wave Charts
    • Elliott Wave Edge – How Elliott Wave Traders Win
    • Fibonacci Number Series and Elliott Waves
    • How to use Fibonacci Ratio Retracements
    • Elliott Wave Books
      • The Elliott Wave Book – Five Waves to Financial Freedom
      • Dividend Growth Investing Using Elliott Waves
    • Videos
  • Equities
    • Indices
      • Africa
        • Egypt
      • Australia
      • European Indices
        • AEX – Index, Amsterdam
        • DAX Index
        • Istanbul
        • Russia
        • Spain’s IBEX 35
      • Asian Indices
        • India
        • China
        • Dubai
        • Kuwait
        • Kuala Lumpur
        • Pakistan
        • Saudi
        • Taiwan
      • US Indices
        • S&P500
        • Nasdaq
        • Dow Jones
        • Dow Jones Utilities
    • Stocks
      • Asian Stocks
        • Indian Stocks Trading
        • Dubai Stocks Outlook
        • Japanese Stocks
        • Kuwait stocks
        • Saudi Stocks Outlook
      • African Stocks
        • Egyptian Stocks
      • Swiss Stocks
      • Australian Stocks
      • European Stocks
      • US Stocks outlook
      • UK Stocks
  • Commodities
    • Copper
    • Gasoline
    • Gold
    • Natural Gas
    • Oil
    • Palm Oil
    • Raw Sugar
    • Rubber
    • Soybean Oil
    • Silver
  • Forex
    • AUD
    • Bitcoin
    • CAD
    • CHF
    • Euro
    • GBP
    • INR
    • NZD
    • JPY
  • Raves
  • Consulting
    • Consulting
  • Ramki’s Watchlist
Top News

Has Meta (Facebook) stock seen the bottom

March 21, 2022

What Is The Nearest Technical Support For Meta (NASDAQ: FB)

February 7, 2022

Using Elliott Waves to Capture a Trade in S&P500

January 27, 2022
Facebook Twitter Instagram
WaveTimes Blog WaveTimes Blog
Wave times
  • About
  • Elliott Waves
    • Elliott Waves Explained
    • Elliott Wave Magic Illustrated with Wave Charts
    • Elliott Wave Edge – How Elliott Wave Traders Win
    • Fibonacci Number Series and Elliott Waves
    • How to use Fibonacci Ratio Retracements
    • Elliott Wave Books
      • The Elliott Wave Book – Five Waves to Financial Freedom
      • Dividend Growth Investing Using Elliott Waves
    • Videos
  • Equities
    • Indices
      • Africa
        • Egypt
      • Australia
      • European Indices
        • AEX – Index, Amsterdam
        • DAX Index
        • Istanbul
        • Russia
        • Spain’s IBEX 35
      • Asian Indices
        • India
        • China
        • Dubai
        • Kuwait
        • Kuala Lumpur
        • Pakistan
        • Saudi
        • Taiwan
      • US Indices
        • S&P500
        • Nasdaq
        • Dow Jones
        • Dow Jones Utilities
    • Stocks
      • Asian Stocks
        • Indian Stocks Trading
        • Dubai Stocks Outlook
        • Japanese Stocks
        • Kuwait stocks
        • Saudi Stocks Outlook
      • African Stocks
        • Egyptian Stocks
      • Swiss Stocks
      • Australian Stocks
      • European Stocks
      • US Stocks outlook
      • UK Stocks
  • Commodities
    • Copper
    • Gasoline
    • Gold
    • Natural Gas
    • Oil
    • Palm Oil
    • Raw Sugar
    • Rubber
    • Soybean Oil
    • Silver
  • Forex
    • AUD
    • Bitcoin
    • CAD
    • CHF
    • Euro
    • GBP
    • INR
    • NZD
    • JPY
  • Raves
  • Consulting
    • Consulting
  • Ramki’s Watchlist
WaveTimes Blog WaveTimes Blog
Home » How I used Elliott Waves to identify and recommend a stock that made over 30%
Indian Stocks Trading

How I used Elliott Waves to identify and recommend a stock that made over 30%

RamkiBy RamkiMarch 1, 20173 Comments2 Mins Read
Facebook Twitter LinkedIn Telegram Pinterest Tumblr Reddit WhatsApp Email
Share
Facebook Twitter LinkedIn Pinterest Email

A few days ago, I posted some charts of Just Dial, a stock that trades in the Indian Market. Active members of the WaveTimes premium service were sent several charts, pointing out the potential that was ready to be captured. This stock has already returned over 30% from the time I brought it to the attention of members. However, it has actually rallied by nearly 50% from the lows since I first identified it, using Elliott Waves. As this blog is meant to be a ‘living book’, and extension of ‘Five Waves to Financial Freedom’, I thought of sharing with you a few more chart that you can use to enhance your learning and understanding of Elliott Wave Analysis. (Note: all of these were sent to members before the big move happened)

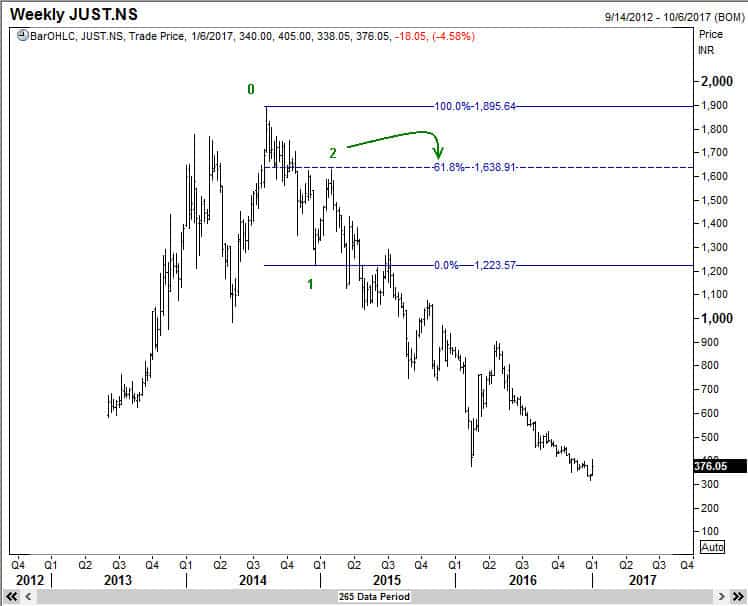
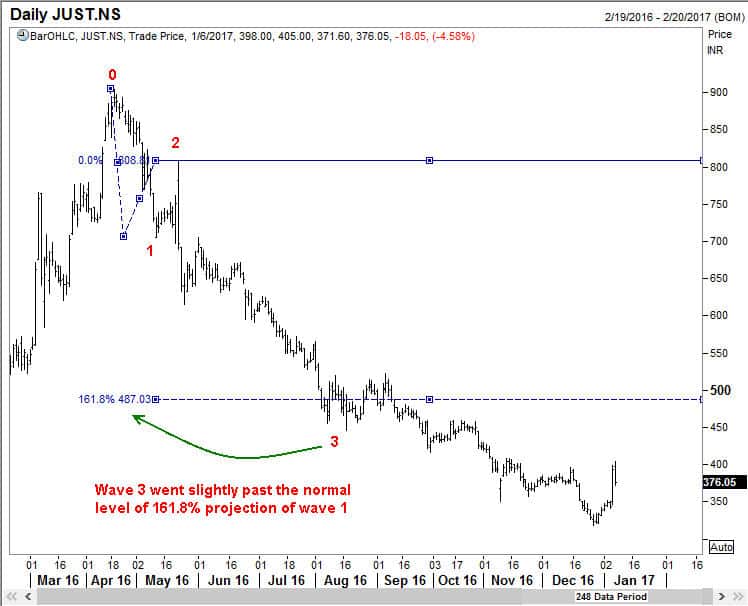
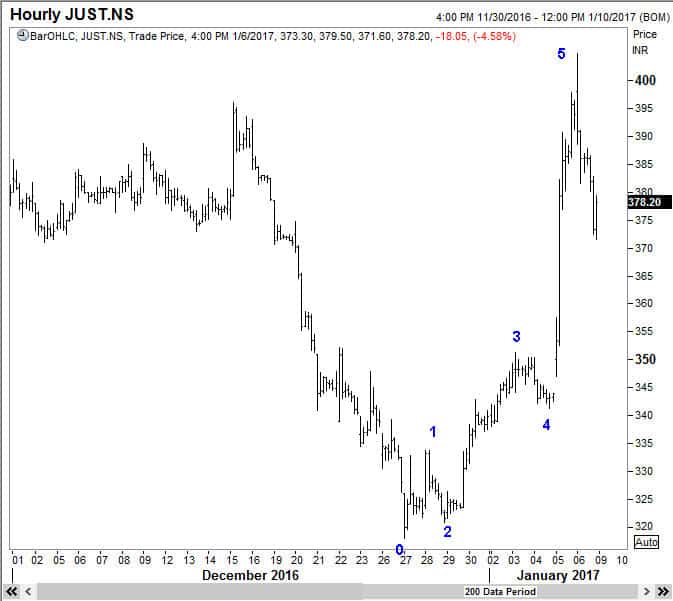
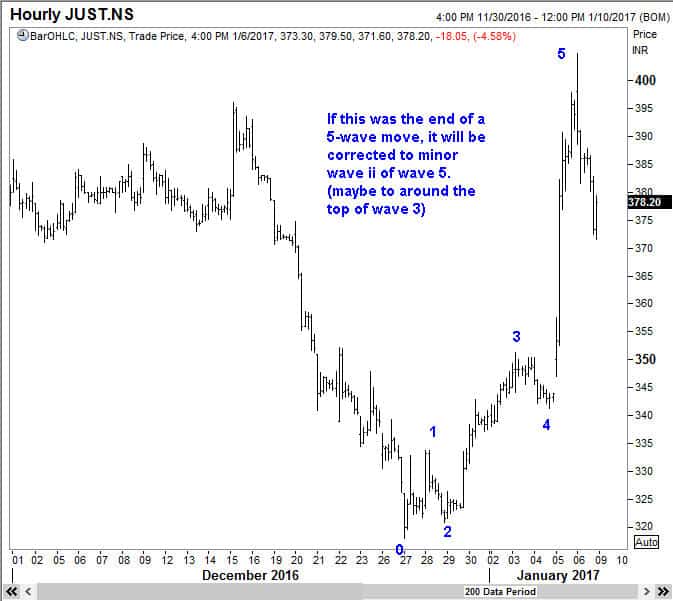
Wave 2 went to 61.8% of wave 1

JustDial 7Jan17a


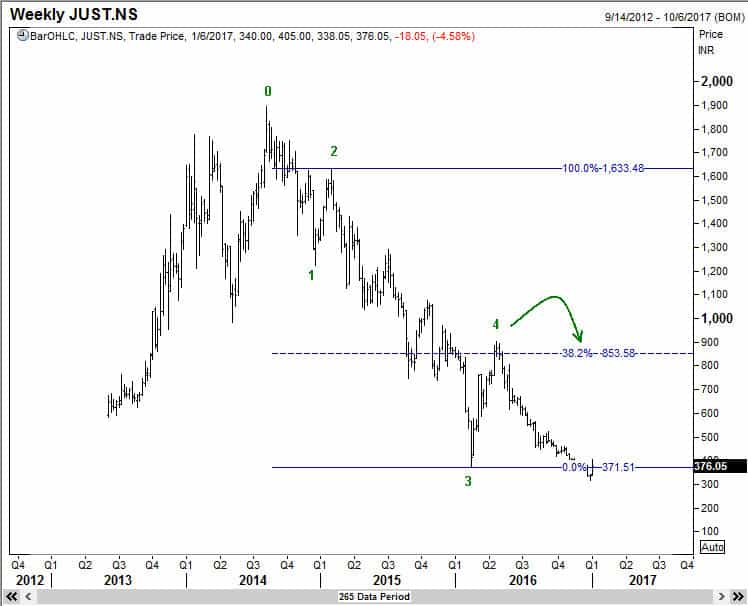
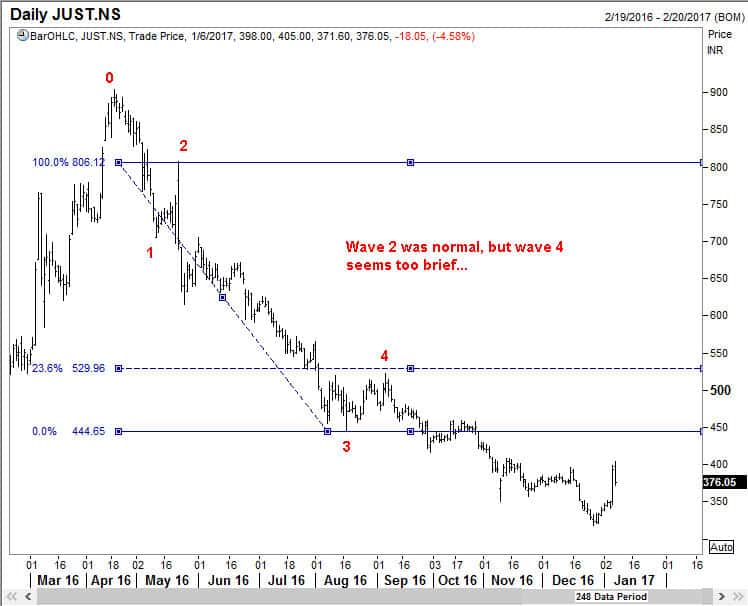
Wave 4 recovered to the 38.2% retracement level of wave 3

JustDial 7Jan17c


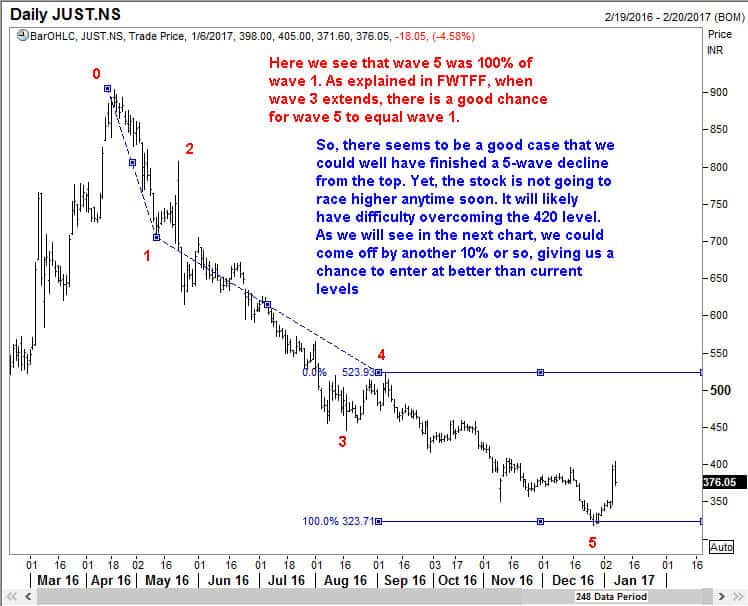
Using the method I have taught in my Elliott Wave book, Five Waves to Financial Freedom, we can see that wave 5 finished exactly at the 38.2% measure of the distance traveled from point 0 to point 3.


JustDial 7Jan17d


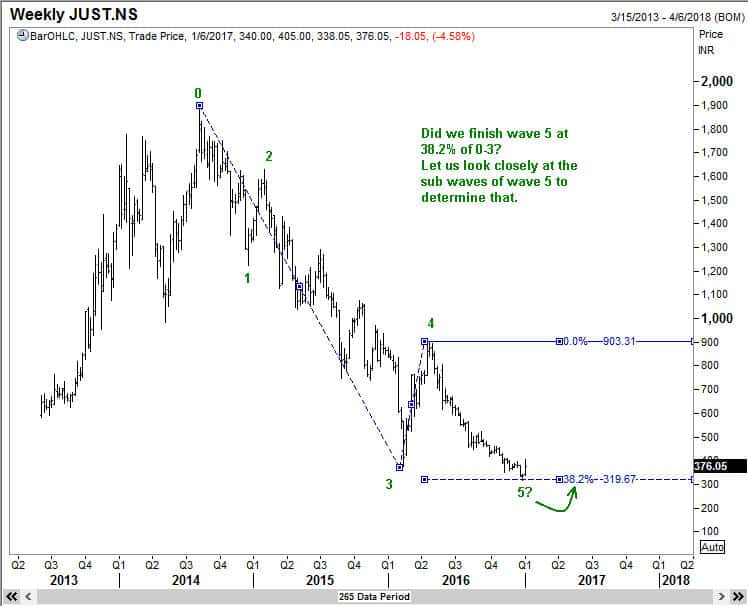
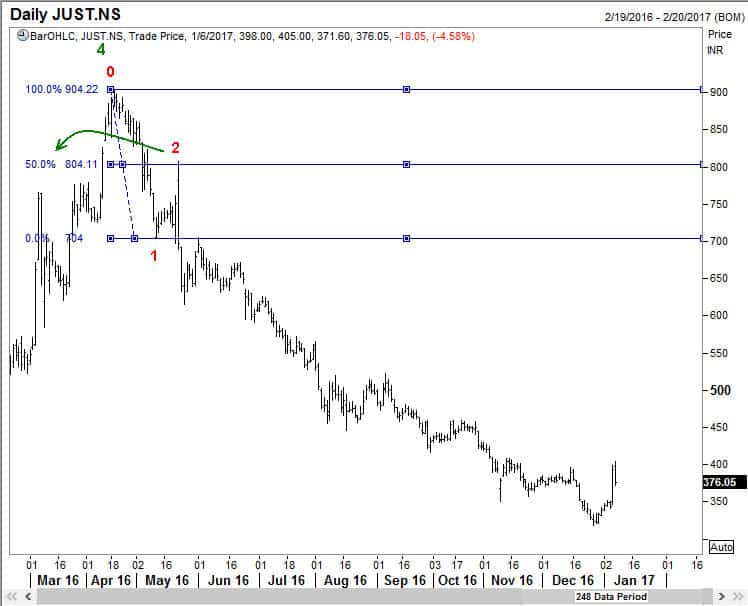
We now analyze the sub waves making up wave 5. In Elliott Waves, all impulse waves are made up of five sub waves. Here you can see that Sub wave 2 was 50% of sub wave 1.

JustDial 7Jan17e


JustDial 7Jan17f


JustDial 7Jan17g

Here, I am applying one more approach discussed in FWTFF Elliott Wave Book. Frequently, two of the three impulse waves in a five wave sequence tend to equality. Here wave 1 is equal to wave 5.

JustDial 7Jan17h


JustDial 7Jan17i


JustDial 7Jan17j


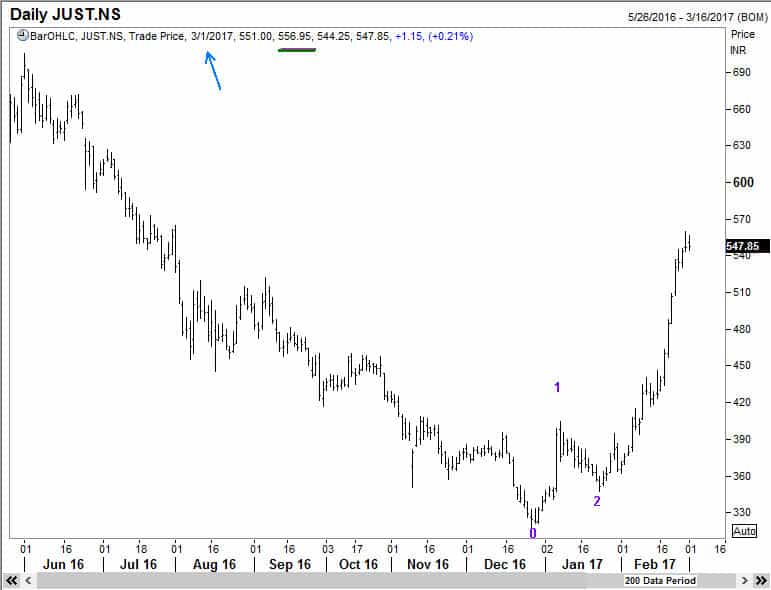
As you can make out from the date on the top left of the charts above, they were prepared on 6 January. And just in case you were wondering where the low came in, it was at 347.60 on 23 January, 2017. Today, 1 March 2017, the stock has been to a high of 556.95, which is about 50% higher from the time when the analysis was done. That is the power of Elliott Wave Analysis.

Power of Elliott Wave Analysis
Elliott Wave Analysis Elliott Waves Just Dial
Share. Facebook Twitter Pinterest LinkedIn Tumblr Telegram Email
Previous ArticleExclusive Offer To Members: Looking to make at least 8% on an Indian Stock
Next Article Spotting an easy 100 pip profit in Forex using Elliott Wave Analysis
Ramki
  • Website

Related Posts

When Elliott Waves applauds the promoter’s signals!

January 3, 2022

A soft quarter for TCS – Avoid or Add – Contd.

October 13, 2021

A soft quarter for TCS — Avoid or add?

October 12, 2021
View 3 Comments

3 Comments

  1. Imran on May 12, 2017 10:20 am

    Ramki,

    Ur analysis using Elliott waves 🌊 are second to none but the best part in my opinion is that your approach to analysis is very simple.

    Thanks for sharing your knowledge.

    Imran

    Reply
  2. Vitalis on June 14, 2018 12:24 pm

    Your analysis are great sir…
    But am still having problems with couting the waves sometimes I get stoped out…

    What’s the best time frames for the big picture

    Reply
    • Ramki Ramakrishnan on June 17, 2018 2:00 pm

      Vitalis, I find that the Daily charts work best for me.

      Reply

Leave A Reply Cancel Reply

Recent Posts
  • Has Meta (Facebook) stock seen the bottom
  • What Is The Nearest Technical Support For Meta (NASDAQ: FB)
  • Using Elliott Waves to Capture a Trade in S&P500
  • Hedge Funds and Elliott Waves – Netflix $NFLX
  • When Elliott Waves applauds the promoter’s signals!

WaveTimes is a Research Organization dedicated to providing original analysis, reports, reviews, and insights on developments in mutual funds, stocks, investing, foreign exchange, commodities, and bonds.

Contact WaveTimes

L-601 Mantri Espana,

Kariyammana Agrahara, Bellandur, Bangalore 560103

Follow Us

  • Facebook
  • YouTube
  • Twitter

© 2023 Wave Times. All Rights Reserved.
  • About
  • Books
  • Privacy Policy
  • Policies and Standards

Type above and press Enter to search. Press Esc to cancel.