• About
  • Elliott Waves
    • Elliott Waves Explained
    • Elliott Wave Magic Illustrated with Wave Charts
    • Elliott Wave Edge – How Elliott Wave Traders Win
    • Fibonacci Number Series and Elliott Waves
    • How to use Fibonacci Ratio Retracements
    • Elliott Wave Books
      • The Elliott Wave Book – Five Waves to Financial Freedom
      • Dividend Growth Investing Using Elliott Waves
    • Videos
  • Equities
    • Indices
      • Africa
        • Egypt
      • Australia
      • European Indices
        • AEX – Index, Amsterdam
        • DAX Index
        • Istanbul
        • Russia
        • Spain’s IBEX 35
      • Asian Indices
        • India
        • China
        • Dubai
        • Kuwait
        • Kuala Lumpur
        • Pakistan
        • Saudi
        • Taiwan
      • US Indices
        • S&P500
        • Nasdaq
        • Dow Jones
        • Dow Jones Utilities
    • Stocks
      • Asian Stocks
        • Indian Stocks Trading
        • Dubai Stocks Outlook
        • Japanese Stocks
        • Kuwait stocks
        • Saudi Stocks Outlook
      • African Stocks
        • Egyptian Stocks
      • Swiss Stocks
      • Australian Stocks
      • European Stocks
      • US Stocks outlook
      • UK Stocks
  • Commodities
    • Copper
    • Gasoline
    • Gold
    • Natural Gas
    • Oil
    • Palm Oil
    • Raw Sugar
    • Rubber
    • Soybean Oil
    • Silver
  • Forex
    • AUD
    • Bitcoin
    • CAD
    • CHF
    • Euro
    • GBP
    • INR
    • NZD
    • JPY
  • Raves
  • Consulting
    • Consulting
  • Ramki’s Watchlist
Top News

Has Meta (Facebook) stock seen the bottom

March 21, 2022

What Is The Nearest Technical Support For Meta (NASDAQ: FB)

February 7, 2022

Using Elliott Waves to Capture a Trade in S&P500

January 27, 2022
Facebook Twitter Instagram
WaveTimes Blog WaveTimes Blog
Wave times
  • About
  • Elliott Waves
    • Elliott Waves Explained
    • Elliott Wave Magic Illustrated with Wave Charts
    • Elliott Wave Edge – How Elliott Wave Traders Win
    • Fibonacci Number Series and Elliott Waves
    • How to use Fibonacci Ratio Retracements
    • Elliott Wave Books
      • The Elliott Wave Book – Five Waves to Financial Freedom
      • Dividend Growth Investing Using Elliott Waves
    • Videos
  • Equities
    • Indices
      • Africa
        • Egypt
      • Australia
      • European Indices
        • AEX – Index, Amsterdam
        • DAX Index
        • Istanbul
        • Russia
        • Spain’s IBEX 35
      • Asian Indices
        • India
        • China
        • Dubai
        • Kuwait
        • Kuala Lumpur
        • Pakistan
        • Saudi
        • Taiwan
      • US Indices
        • S&P500
        • Nasdaq
        • Dow Jones
        • Dow Jones Utilities
    • Stocks
      • Asian Stocks
        • Indian Stocks Trading
        • Dubai Stocks Outlook
        • Japanese Stocks
        • Kuwait stocks
        • Saudi Stocks Outlook
      • African Stocks
        • Egyptian Stocks
      • Swiss Stocks
      • Australian Stocks
      • European Stocks
      • US Stocks outlook
      • UK Stocks
  • Commodities
    • Copper
    • Gasoline
    • Gold
    • Natural Gas
    • Oil
    • Palm Oil
    • Raw Sugar
    • Rubber
    • Soybean Oil
    • Silver
  • Forex
    • AUD
    • Bitcoin
    • CAD
    • CHF
    • Euro
    • GBP
    • INR
    • NZD
    • JPY
  • Raves
  • Consulting
    • Consulting
  • Ramki’s Watchlist
WaveTimes Blog WaveTimes Blog
Home » How Elliott Waves helped WaveTimes members to exit before the stock market crash
India

How Elliott Waves helped WaveTimes members to exit before the stock market crash

RamkiBy RamkiMarch 27, 202024 Comments4 Mins Read
Facebook Twitter LinkedIn Telegram Pinterest Tumblr Reddit WhatsApp Email
Share
Facebook Twitter LinkedIn Pinterest Email

Stock markets around the world have crashed. But Elliott Waves had warned of a deep correction several days before it actually happened. This post will show you how Elliott Waves helped members of my exclusive club to exit their positions before the crash. Remember, this free blog is a learning resource for you, and this post is only sharing a few charts to aid you. I have a consulting service, and members who asked for SnP500 or the Nifty or Gold or Oil had benefited. 

In this post, we will look at India’s Nifty. As explained in my online program, I start with a long-term chart to get a feel of where we are in the big picture. My members know that I spend more time on the weekly and daily charts to determine my trades. Beginning traders spend a lot of time analyzing the short term charts such as 5 or 10-minute charts, and generally that is a complete waste of time.

Here, for example, I started with the monthly chart of India’s Nifty index.


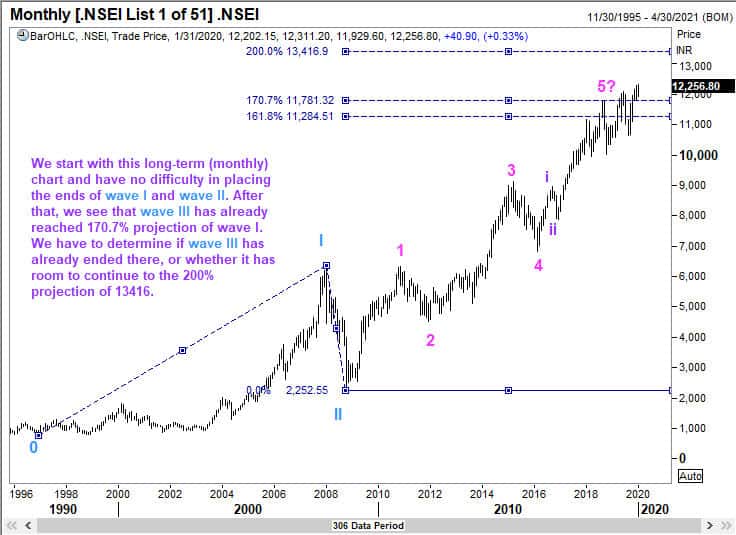
So you see that I was establishing that a major wave III was nearing completion, perhaps around 12716. 

I will save you from all the other charts that went in-between, but present you with the final chart where I have drawn conclusions. You will see the date of the analysis as 10 January 2020, and the Nifty Index was trading at 12,256 (the last price seen on the Y axis to the right, in bold black color). I had already discussed that we were in an ending diagonal for the major wave III, and that sub wave V should be made up of 3 waves, a,b,and c and that we were in wave c. This wave c should have 5 mini waves (red color in the chart) and we were in the final wave v. The possible targets were 12531 and 12672. It actually finished at 12430 ten days later, on 20 Jan 2020.  The trader who waits for the last tic to sell is often disappointed. But in this analysis, I had also said that once we trade below 11694 at ANYTIME from that moment onward,  we should assume the top is in place and therefore start selling on pull backs.  Here is the chart.

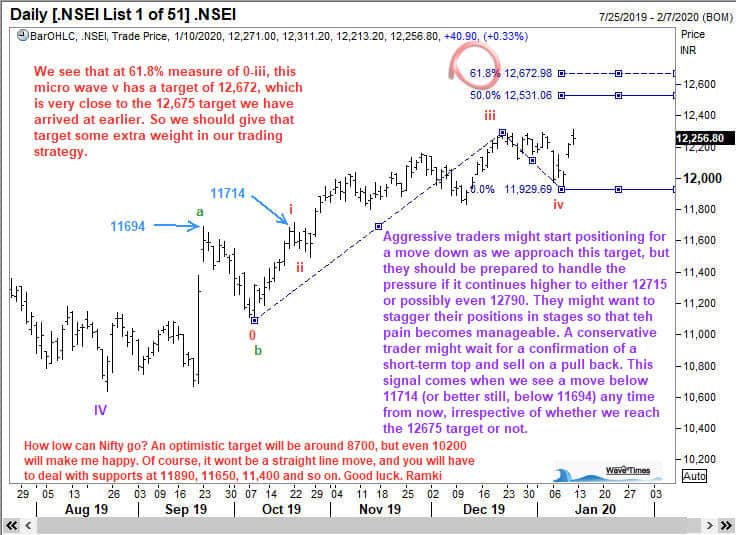
For the record, on 3rd February, we made a low of 11614 and then recovered slowly to a high of 12246.  This means we were almost at the same level as where we were on 10 Jan 2020. Could we have asked for more?

If you read the comments in the bottom of the chart, in red color, I have said that an optimistic target for the correction will be 8700. Little did I know that a global pandemic would be upon us in a matter of days. The Nifty index reached 8700 on 13 March, 2 months after I sent these charts to my members. Even at 8700, that is 30% down from the top. Of course, we have been lower still, to 7510 since then, which is 40% down. The point is, Elliott Waves did warn us of an imminent top, and you too could have spotted it had you employed the knowledge you gained from my book Five Waves to Financial Freedom and this free online blog. Of course, my online Elliott Wave program spends a lot of time teaching you how to use the theory, which makes all the difference to your bottom line. Learning the theory is not difficult, especially if you have read FWTFF. But you should also know how to apply that knowledge. 

A key point to note is this. My above analysis has served its purpose in anticipating the fall. But the wave counts that I have used there needs to be revisited. Indeed, no wave count is cast in stone. And this something that you should always bear in mind. 

Stock Market Crash
Share. Facebook Twitter Pinterest LinkedIn Tumblr Telegram Email
Previous ArticleDamani buys 2.75% stake in India Cements
Next Article ElliottWaves helped WaveTimes members make 15% in a under a week
Ramki
  • Website

Related Posts

How we traded Castrol India using Elliott Waves

December 9, 2019

Nifty rallied up in 5 waves

July 10, 2015

Elliott Wave Analysis of Nifty – Ramki's CNBC Interview

June 24, 2015
View 24 Comments

24 Comments

  1. Gopal on March 27, 2020 2:23 pm

    Hi, nice analysis sir!
    But where is the extended wave in wave 3??

    Reply
    • Ramki Ramakrishnan on March 29, 2020 8:16 am

      Gopal,
      In my original analysis (that is partially published), wave III had 5 waves inside it, shown in pink color. The fifth wave was the largest of the three impulse waves that made up wave III, and hence, one interpretation is that it was an extended wave 5.Remember, I discard every analysis once it meets my goal. A fresh analysis has been sent to members since then, as recently as 27March2020.

      Reply
  2. Prabh on March 27, 2020 5:45 pm

    Hi Ramki,

    In your books or any of your blogs ,you have hardly talked about this new 170.7% fib ratio and that too for third waves.Is this new invention?

    Reply
    • Ramki Ramakrishnan on March 29, 2020 8:20 am

      Prabh,
      Thank you for asking that question. First of all, 170.7% is not a Fibonacci ratio. However, I have applied it in my own work with some success, just as I have also used 361.8%. Remember, Elliott Wave Principle uses Fibonacci Ratios as an aid. The emphasis is on the waves and not the measurement. Secondly, even in FWTFF, I have said quite early that the reader will find some instances where I am introducing a few tweaks of my own that is not original or pedigree Elliott. I have dealt with this in detail in my online course.
      Finally, this is not an invention! Just a small tweak that sometimes works for me.

      Reply
  3. mihir on March 28, 2020 6:54 am

    why did you select point zero at the mentioned bottom , rather there was one more bottom ahead in April 1993. pls clear the doubt.

    Reply
    • Ramki Ramakrishnan on March 29, 2020 8:26 am

      Mihir, Great question. My system did not show history before 1995. It is likely that the ratios would be a better fit had I chosen the real low. But in the big picture, it is not going to make a very big difference, because we know that wave III began where I have shown, and so I didn’t sweat too much on the data point that would have given me a more accurate measure of the starting point of wave I. Remember, even in FWTFF book, I have said that we choose a significant low that is more recent to decide our trades, as we don’t need to go back to the very beginning if our goal is to trade. It is different if you wnat to publish a research paper, though 🙂

      Reply
  4. Khalid on March 28, 2020 5:44 pm

    Mr Ramki

    Would you share with us what is the subscription fee with Thomson Reuters as I find your charts very clear and does it cover all the markets worldwide or it depends on the market you trade-in. thanks

    Reply
    • Ramki Ramakrishnan on March 29, 2020 8:28 am

      Hi Khalid, You can approach Thomson Reuters in your country to find out what are the subscription rates. They have a tiered pricing strategy based on products and geography etc

      Reply
  5. Mihir on March 29, 2020 6:27 pm

    Can we consider wave 3 as extended with 170.70% retracemnt ?

    Reply
    • Ramki Ramakrishnan on March 30, 2020 6:27 am

      Mihir,
      This has been covered both in the book and in the course. Moreover, remember I discard my old analysis once my goal of taking a low-risk trade is achieved?

      Reply
  6. Junichiro on March 30, 2020 2:55 am

    Hi, Mr Ramki
    If your long term monthly chart (1st chart) is the guide, we have probably completed wave 3. But inside this wave 3, wave 3 (pink color) did not extend and wave 5 (pink color) did not extend either, which is contrary to Elliott wave theory ?

    Reply
    • Ramki Ramakrishnan on March 30, 2020 6:40 am

      Junichiro,
      An impulse wave is considered as extended if it is of an unusual length. In my opinion, (which may not be shared by others), I consider a wave as extended if it exceeds the 161.8% projection by more than a couple of percentage points.

      Reply
  7. Nick on March 30, 2020 8:08 am

    Dear Sir,

    Thank you for one more great analysis!

    It seems being a long time you have not posted any analysis for gold. Would you please take a look on gold once you have some free time.

    By the way, I sometimes have a hard time distinguishing between a zigzag or an impulse wave. Sometimes a pattern looks like a zigzag or an impulse with big 4th wave and an extende 5th wave, can you give me advice on this problem?

    Thank you for your great work and have a nice day, sir!

    Reply
    • Ramki Ramakrishnan on March 30, 2020 8:11 am

      Nick,
      Maybe it is time to revise FWTFF book, or better still, consider enrolling in the online course, a small investment for long-term benefit.

      Reply
  8. raj d on April 4, 2020 5:14 pm

    Hi Ramki. Hope all is well. I am Raj from Kuwait. It was interesting to read your Wave pattern. For investor like me, what is the best time to start deploying funds ? when the volatility to will stop ? I am looking for some guidance on timing to invest.

    Reply
    • Ramki Ramakrishnan on April 6, 2020 7:59 am

      Raj, thank you for writing. A couple of points. Never invest in the stock market for funds you might need in the next 4-5 years. By its very nature, equity markets are volatile, so you can never be sure which stock will tank, and which will take off to the skies. On the other hand, volatility is a trader’s friend. Elliott Waves are a great tool in the hands of a trader who knows how to use it well. The trader’s horizon is generally the short term, and in a well-traded market, Elliott Waves work very well, especially when emotions are high!
      As for timing of investment for time frames longer than 5 years, you can start now and stagger your investments over several weeks so that you are well positioned in good quality stocks or indices. You are not so keen to catch the very bottom, but you are looking to reap a much better return than a fixed deposit and are willing to take the risk of volatility in the interim period.
      All the best.

      Reply
  9. Susantamohapatra on June 17, 2020 7:12 pm

    Sir after online course if any dout how can I clear my dout?

    Reply
    • Ramki Ramakrishnan on June 18, 2020 5:22 am

      Susanta, If the doubt is specifically about something mentioned in the course, then of course I will be happy to clarify via email. If someone wants me to validate their own analysis of some instrument, then I will have to express my regrets because there are too many students. Besides, my course will make the need for such validation redundant as you will know once you finish the program. All the best.

      Reply
  10. Mrinal Sourav Mondal on August 4, 2020 3:56 am

    Hi sir,
    In this analysis can it be possible that last impulse wave was wave 5 and now we are in B wave of wave 2 in higher degree?

    Reply
    • Ramki Ramakrishnan on August 8, 2020 12:07 pm

      Mrinal, You are a student of my online program if I remember right! This kind of question is examined in detail there.

      Reply
  11. Ashok Singh on August 16, 2020 7:09 pm

    Hello Ramki Sir,

    First of Thank you for invaluable book FWTFF . For academic purpose, I am applying the same principle to FTSE 100 chart starting from Monthly and drilling down to Daily. It seems the FTSE 100 is not following EW Charting pattern . I have tried 2 approached in monthly chart.
    1. Starting from significant low of March 2003 as point 0 lead to contradiction where point 4 is way below point 1
    2. Starting from significant low of March 2003 as point 0 and create point 1 at recent high of May 2019 . In this approach Impulse wave 1 should have 5 Wave which bring back to point 1 .

    I am looking into Diagonal theory , just wanted to be sure my approach is correct so far.

    Many Thanks
    Ashok

    Reply
  12. Sudhanshu Pradhan on November 22, 2020 10:13 am

    Thank you so much for the clarity on the Wave count on higher degree. That the crash was wave 4 and we are in Bull cycle since December’96. This also means Wave-5 being played-out now and should be cautious (around 14000 region) for obvious reasons!
    Also that Wave 3 of 5 (of Wave-5) was extended.
    There couldn’t have been a better name for your book FWTFF & your online course takes it to the next level.

    Reply
    • Ramki Ramakrishnan on November 22, 2020 10:13 pm

      Sudhanshu, Thank you for taking time to write.

      Reply
  13. Sachin Balan on January 26, 2021 7:52 pm

    Hello Ramki,
    Nice explanation sir.
    Great to have found you!!
    Read your book today, I will go through it few more times.
    Will reach out if I have any queries.

    Thanks,
    Sachin

    Reply

Leave A Reply Cancel Reply

Recent Posts
  • Has Meta (Facebook) stock seen the bottom
  • What Is The Nearest Technical Support For Meta (NASDAQ: FB)
  • Using Elliott Waves to Capture a Trade in S&P500
  • Hedge Funds and Elliott Waves – Netflix $NFLX
  • When Elliott Waves applauds the promoter’s signals!

WaveTimes is a Research Organization dedicated to providing original analysis, reports, reviews, and insights on developments in mutual funds, stocks, investing, foreign exchange, commodities, and bonds.

Contact WaveTimes

L-601 Mantri Espana,

Kariyammana Agrahara, Bellandur, Bangalore 560103

Follow Us

  • Facebook
  • YouTube
  • Twitter

© 2023 Wave Times. All Rights Reserved.
  • About
  • Books
  • Privacy Policy
  • Policies and Standards

Type above and press Enter to search. Press Esc to cancel.