• About
  • Elliott Waves
    • Elliott Waves Explained
    • Elliott Wave Magic Illustrated with Wave Charts
    • Elliott Wave Edge – How Elliott Wave Traders Win
    • Fibonacci Number Series and Elliott Waves
    • How to use Fibonacci Ratio Retracements
    • Elliott Wave Books
      • The Elliott Wave Book – Five Waves to Financial Freedom
      • Dividend Growth Investing Using Elliott Waves
    • Videos
  • Equities
    • Indices
      • Africa
        • Egypt
      • Australia
      • European Indices
        • AEX – Index, Amsterdam
        • DAX Index
        • Istanbul
        • Russia
        • Spain’s IBEX 35
      • Asian Indices
        • India
        • China
        • Dubai
        • Kuwait
        • Kuala Lumpur
        • Pakistan
        • Saudi
        • Taiwan
      • US Indices
        • S&P500
        • Nasdaq
        • Dow Jones
        • Dow Jones Utilities
    • Stocks
      • Asian Stocks
        • Indian Stocks Trading
        • Dubai Stocks Outlook
        • Japanese Stocks
        • Kuwait stocks
        • Saudi Stocks Outlook
      • African Stocks
        • Egyptian Stocks
      • Swiss Stocks
      • Australian Stocks
      • European Stocks
      • US Stocks outlook
      • UK Stocks
  • Commodities
    • Copper
    • Gasoline
    • Gold
    • Natural Gas
    • Oil
    • Palm Oil
    • Raw Sugar
    • Rubber
    • Soybean Oil
    • Silver
  • Forex
    • AUD
    • Bitcoin
    • CAD
    • CHF
    • Euro
    • GBP
    • INR
    • NZD
    • JPY
  • Raves
  • Consulting
    • Consulting
  • Ramki’s Watchlist
Top News

Has Meta (Facebook) stock seen the bottom

March 21, 2022

What Is The Nearest Technical Support For Meta (NASDAQ: FB)

February 7, 2022

Using Elliott Waves to Capture a Trade in S&P500

January 27, 2022
Facebook Twitter Instagram
WaveTimes Blog WaveTimes Blog
Wave times
  • About
  • Elliott Waves
    • Elliott Waves Explained
    • Elliott Wave Magic Illustrated with Wave Charts
    • Elliott Wave Edge – How Elliott Wave Traders Win
    • Fibonacci Number Series and Elliott Waves
    • How to use Fibonacci Ratio Retracements
    • Elliott Wave Books
      • The Elliott Wave Book – Five Waves to Financial Freedom
      • Dividend Growth Investing Using Elliott Waves
    • Videos
  • Equities
    • Indices
      • Africa
        • Egypt
      • Australia
      • European Indices
        • AEX – Index, Amsterdam
        • DAX Index
        • Istanbul
        • Russia
        • Spain’s IBEX 35
      • Asian Indices
        • India
        • China
        • Dubai
        • Kuwait
        • Kuala Lumpur
        • Pakistan
        • Saudi
        • Taiwan
      • US Indices
        • S&P500
        • Nasdaq
        • Dow Jones
        • Dow Jones Utilities
    • Stocks
      • Asian Stocks
        • Indian Stocks Trading
        • Dubai Stocks Outlook
        • Japanese Stocks
        • Kuwait stocks
        • Saudi Stocks Outlook
      • African Stocks
        • Egyptian Stocks
      • Swiss Stocks
      • Australian Stocks
      • European Stocks
      • US Stocks outlook
      • UK Stocks
  • Commodities
    • Copper
    • Gasoline
    • Gold
    • Natural Gas
    • Oil
    • Palm Oil
    • Raw Sugar
    • Rubber
    • Soybean Oil
    • Silver
  • Forex
    • AUD
    • Bitcoin
    • CAD
    • CHF
    • Euro
    • GBP
    • INR
    • NZD
    • JPY
  • Raves
  • Consulting
    • Consulting
  • Ramki’s Watchlist
WaveTimes Blog WaveTimes Blog
Home » How Elliott Wave helped us make over 16% in 6 weeks
Indian Stocks Trading

How Elliott Wave helped us make over 16% in 6 weeks

RamkiBy RamkiAugust 1, 20183 Comments1 Min Read
Facebook Twitter LinkedIn Telegram Pinterest Tumblr Reddit WhatsApp Email
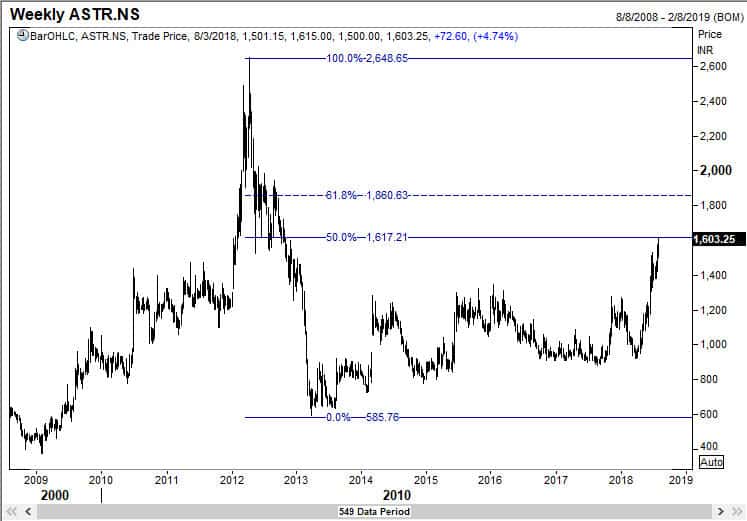
This chart shows Astrazeneca dipped to our buy zone
Share
Facebook Twitter LinkedIn Pinterest Email

This blog exists to help you learn and apply the Elliott Wave techniques that I practice. Many consider it as an extension of the Elliott Wave book “Five Waves to Financial Freedom“.  I post some of the trades that members of the WaveTimes exclusive club have participated in, solely with the intention of helping you look at yet another real-life example of what could be achieved if we patiently wait for a proper set up.

You may download the full analysis here:
Astrazeneca


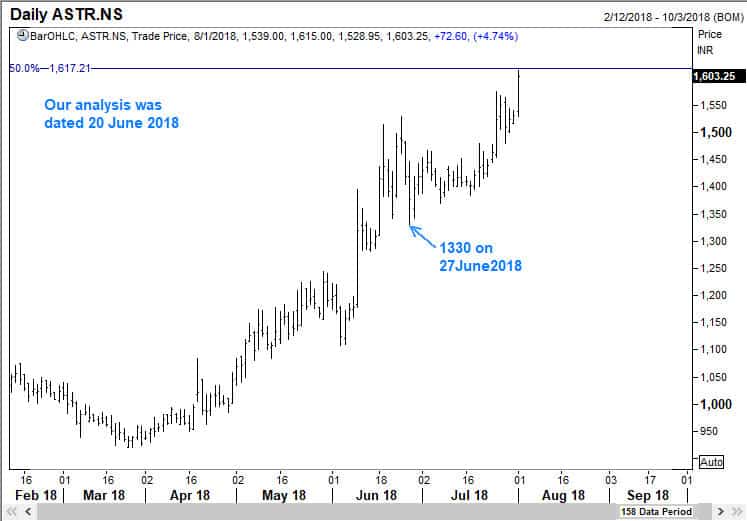
Astrazeneca dipped to our buy zone and rallied by over 16%
This chart shows Astrazeneca dipped to our buy zone

Astrazeneca approached the 50% retracement level

Many members prefer to use the consulting option at WaveTimes before they make large investment or trading decisions.

All the best


Astrazeneca
Share. Facebook Twitter Pinterest LinkedIn Tumblr Telegram Email
Previous ArticleUsing Elliott Waves to anticipate a big sell off in Manappuram Finance Ltd
Next Article How Elliott Waves enabled us to anticipate multiple turning points in GBPUSD
Ramki
  • Website

Related Posts

When Elliott Waves applauds the promoter’s signals!

January 3, 2022

A soft quarter for TCS – Avoid or Add – Contd.

October 13, 2021

A soft quarter for TCS — Avoid or add?

October 12, 2021
View 3 Comments

3 Comments

  1. yogesh on August 22, 2018 9:31 am

    Respected Sir,
    I learnt a lot from your blog.
    Thank you for this analysis.
    I saw triangle at start after abc correction was over.To me nowdays its very difficult to handle these triangles sometime they look in 3-3-3-3-3 sometime they look 5-3-5-3-5..Ijust want to know anykind of triangle appear at wave1 & wave5 or there is any fix trangle appears at these positions .If possible give me simple way to mark it.

    Reply
    • Ramki Ramakrishnan on September 4, 2018 5:03 am

      Yogesh, I suggest that you read a good book on Elliott Waves and that should cover the subject of (diagonal)triangles at wave 1 and wave 5 positions

      Reply
  2. narayan singh on October 5, 2018 8:09 am

    thanks sir!!
    this is the first sentence I wud like to say to you….I hve learnt a lot from u and ur book.
    but still there is onething which is not clear….a normal wave 1 or normal wave 3///how can we determine a normal wave with its internal subwave…sir plzzz…give provide us a chart on it…so that we can learn more from you…
    thank you sir

    Reply

Leave A Reply Cancel Reply

Recent Posts
  • Has Meta (Facebook) stock seen the bottom
  • What Is The Nearest Technical Support For Meta (NASDAQ: FB)
  • Using Elliott Waves to Capture a Trade in S&P500
  • Hedge Funds and Elliott Waves – Netflix $NFLX
  • When Elliott Waves applauds the promoter’s signals!

WaveTimes is a Research Organization dedicated to providing original analysis, reports, reviews, and insights on developments in mutual funds, stocks, investing, foreign exchange, commodities, and bonds.

Contact WaveTimes

L-601 Mantri Espana,

Kariyammana Agrahara, Bellandur, Bangalore 560103

Follow Us

  • Facebook
  • YouTube
  • Twitter

© 2023 Wave Times. All Rights Reserved.
  • About
  • Books
  • Privacy Policy
  • Policies and Standards

Type above and press Enter to search. Press Esc to cancel.