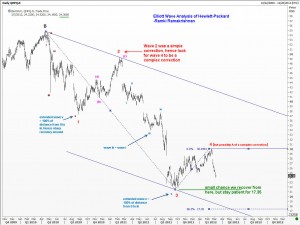
ELliott Wave analysis warns that Hewlett Packard has 25% downside potential. Any direct recovery to around $25.40 should be sold with a close by stop, and one could start taking profits in stages from near $21.50, riding a core position down to $17.35. Take a look at this chart of Hewlett Packard [NYSE: HPQ].

You can see several Elliott Wave relationships that were respected. These have all been explained in detail in my book “Five Waves to Financial Freedom” in simple language. If you already have that book, you could use this chart as yet another example of how the magic of Elliott Wave could have helped you trade this (and other stocks) profitably on so many occasions. You never need to take big risks in the market. Elliott Waves allow you to identify low-risk entry levels. Enjoy.

