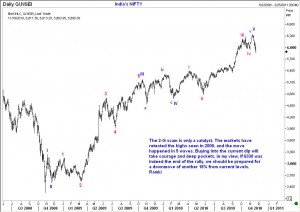
How conveniently the 2-G scam has boiled over just when the NIFTY index has come within a handshake of the 2008 highs! But if you go back in time and look at all major events, you will find that technicals were also just about ripe for a turn in direction. The attached chart shows that a 5 wave pattern has probably finished at 6338. If we get any recovery in the coming days, you should watch the speed of that recovery. Anything less than spectacular will mean that we will likely be headed lower in the next seveal weeks/months, and hence you might wish to take profits from a significant portfion of your portfolio.
- About
- Elliott Waves
- Equities
- Commodities
- Forex
- Raves
- Consulting
- Ramki’s Watchlist
Previous ArticleElliott Wave Analysis of EUR/USD 10 Nov 2010
Next Article COMEX SILVER :Elliott Wave Analysis
17 Comments
Respected sir,
I have read most of your articles and very much impressed by them as you explain each and everything very efficiently.Sir,I am working as a technical analyst from last 4 years and my job profile is to recommend intraday calls as well as provide calls on weekly basis totally based on technical analysis.Sir I can interpret the movement easily but could not judge the movement of wave count.I would be obliged if you can guide me about elliot waves which can help me in strengthning my position and promotion if you teach me some concepts of elliot waves thoroughly.
Thanx sir,
yours faithfully
parminder chauhan
Equity technical analyst
Parminder, The best way to learn anything is to experience it. After you read a couple of good books on Elliot Waves, you should attempt to anticipate moves and then check out how it turned out. Pay particular attention to wave personalities. Good luck.
Hi sir,
This is kumar from india, iam working as a technical analyst. iam very much intrest about wave theory after seeing your analysis and explination and wave counting on various commdoities…. if u dont mind can u pls postt your analysis on COMEX SILVER…and pls describe currently which wave would be running….
Thank’s& regard’s
kumar
Dear sir
I am too much impressed by your views . my English is not so good so that I want to ask you that can nifty fall 18% more from this level. Also sir if I want get in touch with you then how ?
Rajendra, You should start by understanding that having a view is not the same thing as trading the view. The expectation of an 18% decline is the foundation for your trade. This means you will start planning where and how and how much to sell. You should also have a stop-loss plan, because no one can be 100% sure of the future. But having a plan based on wave theory is one of the many approaches to the market.Best of luck.
sir,
below which level would it be confirmed that we have indeed done 5th wave top @ 6338.
could you also post weekly Nifty & gold elliot count.
Manish, you are asking some very shrewd questions 😉
If we touch 5700, then 6338 is confirmed as a top. Thereafter overseas fund managers will start selling into recoveries.
Dear Sir,
I am regular practitioner of Elliott wave theory.
I have gone thorugh the labelling performed by yourself on recent nifty. I had done the labelling in the same way except that in the last part rise of nifty.
Here you have completed the 5th wave but I was not able to see the final 5 waves of 5th wave struture that begun end of May 2010. I still believe that market is moving in the 4th wave and that the last 5th wave is yet to come which might take us to somewhere around 67xx. (Fibo – projection) and any break below 5536 will completely disrupt this counting and will made us believe that indeed the 5 wave had been completed by now.
Please let me know your opinion on this.
Regards
Rito
Rito, with wave counting there is never certainty until after the move is over. Most of the time one makes a call based on his/her experience. I believe that violation of 5700 is enough to confirm that we have already posted the end of the 5th. This happened Friday. Good luck.
Dear Sir,
I’m learning EW analysis and ur help is immense in it…
Sir on 02 DEC. nifty has made a high of 6038.90 .Does it make any difference in counts?
kind regards
5700 held on with nf low at 5690 and now back to 6000. sir do u think the previous 5 u marked was b and c was 5690 low of 4 by the rule of alternation zigzag 2 and flat 4 ??
if so then we still can see new highes ?
Once we take out 5690 again, look for a further downmove of 7% to start with.
Shall we expect now a fall upto 5500?
Sir,…I would like to thank u for all the updates …it really helps when a lot of people are doing this rather than doing alone…….i think the fall from November was actually the 4th wave……as of today we have broken 6100 to the upside….so i this this is really the 5th wave….but i dont think we are going as high as 6700…any way is there any way to tell how high can this 5th wave go…..any Fibo projections…..oh one more thing….the indian market is going exactly inversely to the dollar…..
Hi Jon,
Wave 5 can end up as a failure or a complex ED. If it were a clear IM sometimes it tops out around wave 1 = wave 5 of that degree.
I would be watching the recent high posted as the top. The volume is tepid in this upmove indicative of either a wave 5 or a corrective upmove for previous IM.
Would like to have feed back from Ramki Sir.
Sir Nifty made 5 waves patern and made a high of 6357 on Jan 2008 and came down 2252 on Oct 2008 . It came 3 waves patern down or 5 waves patern down I am confused and if it has come 3 waves patern down in Oct 2008 then which is the corrective B wave . High 5298 or 4649 .
Sunil, The level that separated the final downmove from the initial downmove is 5298.
So 6357-4468 = 1889 = first leg down
4468-5298 separating wave, you call it B, some may call it X, it doesnt matter now.
5298-2252=3046 second leg down. Observe that 1889 x 1.618 = 3056.