In this Elliott Wave Analysis of Kuala Lumpur Stock Index, you can see the challenges facing the trader who has to decide whether the index has completed a five wave move already, or perhaps it has just posted a third wave top, and we are currently in the fifth wave. Let us start by looking at the first Elliott Wave chart. Here, you can see my Elliott Wave labels marked out clearly. The fourth wave has corrected the third wave by exactly 38.2%.
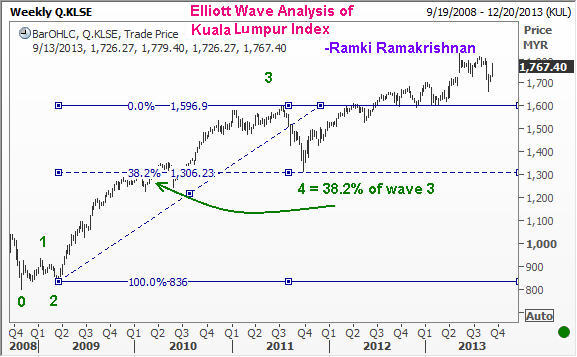
Elliott Wave Analysis of Kuala Lumpur Stock Index by Ramki from WaveTimes.com
Even by looking at the proportion of wave 1 relative to wave 3, you can make out that the third wave had extended.The Wave Principle says that we should expect one of the waves to be extended, but it doesn’t rule out the possibility of two extensions in a five wave sequence. This is illustrated by looking at the next chart which zooms into the fifth wave. In the Elliott Wave count shown below for the fifth wave, you can see that there are two ways to count the waves.
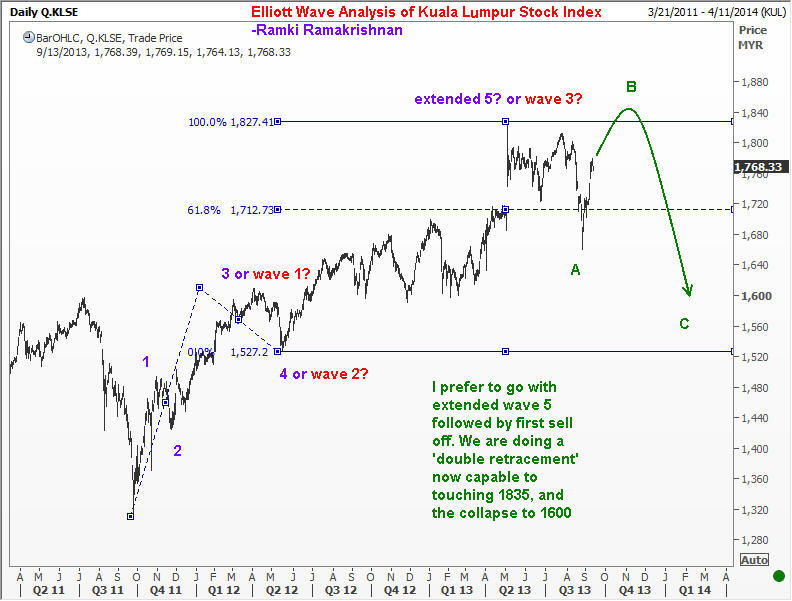
The first count is to label the sub wave 3 as having finished just above the 1600 level, and assuming that we have posted an extended fifth wave at 1827. This is currently my preferred count. As you know from my book “Five Waves to Financial Freedom”, when a fifth wave is extended, we should expect two things to happen. First, there will be a swift correction, but second, and more important, is the possibility of a double retracement of the extended fifth. This means we could see a full retest of the highs, and occasionally even an overthrow to a new high, before another swift sell off. Perhaps this is what is happening now. Should this hypothesis be correct, we should be extra careful near 1835 levels. Be alert for a reversal there, and join in on any swift down move with a stop above the high posted. However, there is another possibility that I have indicated in the chart. This is we have only seen wave 3 finish at 1827, and we are currently in wave 5. You will then compute a 38.2% and a 61.8% of the distance from 0 to 3 to figure out where the 5th wave will finish.These come in at 1860 and 1980. I think there is a better chance for 1860 to cap the move, and so we can summarize by saying that the index will probably post its top between 1835 and 1860 and come off towards 1600. We shall see. Trading the markets of course is a completely different game. It requires you to be patient for the right moment, and for the risk-reward to be properly aligned before you risk real money. I try to implement this strategy at wavetimes.net. But this blog gives you the tools so you can try your hand at it yourself. Remember, picking a top or a bottom is a vanity that the trader needs to entertain with great judgment. It is often safer for the first down move to start and join in on the first pullback. All the best.
Ramki
