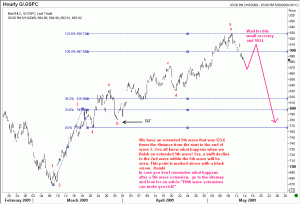
On 5th May I presented you with this chart. The market more-or-less behaved as expected. In a more recent update I warned you to be patient until we get the first clue of a topping out is shown to us. The reason is quite simply we won’t know how far an extedning wave will go until it is finished. The most recent price action suggests to us that a fifth wave top is most likely in place. This means we should get ready to convert our knowledge into money :).
Most of you have read my various posts on how one can make relatively easy money when we get a fifth wave extension. In case you wish to revise your knowledge, then here is the link on how one can get rich if he or she spotted an extending fifth wave!
How far can the anticipated sell-off go? The target comes around 767, which is actually the 2nd wave low of one lesser degree. You should expect a minor support near the 4th wave of lesser degree around 827, but that won’t hold for long. Of considerabe importance is the possibility of a whip back towards the top because after a fifth wave extension is finished, Elliott Wave Principle provides for the market to do what is known as a double retracement.
It is possible to place a low risk trade that is very profitable when you spot the completion of an extending fifth wave.
This means we could get a full move back towards the top after the initial sell off before the final push lower to 767. Unfortunately, this 2nd retracement does not happen all the time. Yet, you should be prepared for it. Occasionally, we even get to establish a HIGHER top, marginally above the fifth wave top. How can one trade with all these possibilities? Where should one place his stops? These are key questions that a wave trader has to ponder over. I suggest that you start selling in stages on any recovery. That way you will at least have something to show for all the trouble, should the market turn around rapidly without going all the way back to the top. In case it does recover to the top, you should still have some room to sell some there.
Suppose you already sold a bit on a mild recovery to around 900, and the market comes off and breaks the low seen before such a recovery, and that too on good volume. (note the words good volume). Then you can add to your shorts, and keep selling all the way till you exhaust your limits. You can lower your stops as the market moves further down.
Elliott wave analysis of S&P500, or for that matter any stock or commodity can be very profitable if you are good in money management. So be sensible about how much you are risking and at what levels. Good luck and hope you make lots on this trade.
Ramki
P.S. DO your friends a favor and send them this article. Even if they don’t take this trade, they can at least join in to witness the magic of Elliott Wave Analysis!
Related S&P500 links:
Was that the stock market bottom?
SNP500 revisited
S&P500 and Citi
Fifth wave extensions can make you rich!
What is a significant rally in the stock markets?
Harmony in markets: S&P500
S&P 500: Potential Ending Diagonal Triangle
Ending Diagonal Triangle in S&P500?
S&P500 Elliott Wave update
S&P500 index: is a top already in?
S&P 500 update: where is the top?
S&P500 continues its rally
S&P500 remains resilient
S&P500 Update: May 19, 2009
S&P500 Elliott Wave update:21 May 2009
S&P 500 breaks higher: update 2 June 2009

