(updated below on 25 Oct 2014)
Elliott Wave theory says that a bull cycle has five waves, and if you look at the chart of Facebook Inc, it looks very probable that the stock has completed its bull cycle. Facebook embarked on its bull run in September 2012 from a low of $17.55. The high seen so far is $79.71, a huge gain indeed. Let us now look at come Elliott Wave charts of Facebook. You should use this example as a supplement to my Elliott Wave book – “Five Waves to Financial Freedom”. Almost the first thing you can see is Facebook has completed five waves in its bull run. You will also see that I use the term ‘probably’ or “highly likely’ in my descriptions because that is the right approach when using Elliott Waves for your trading and investment decisions. There is no tool in the world that gives you a definite answer about the future, and when dealing with the financial markets, it pays to always keep in mind that you are trying to determine the odds of something happening, rather than the certainty. Elliott Wave Theory gives you the framework to do this analysis, and your confidence grows as you see the ‘crowd’ behaving as anticipated by the theory. As you read further, I suggest you open the charts in a new tab.
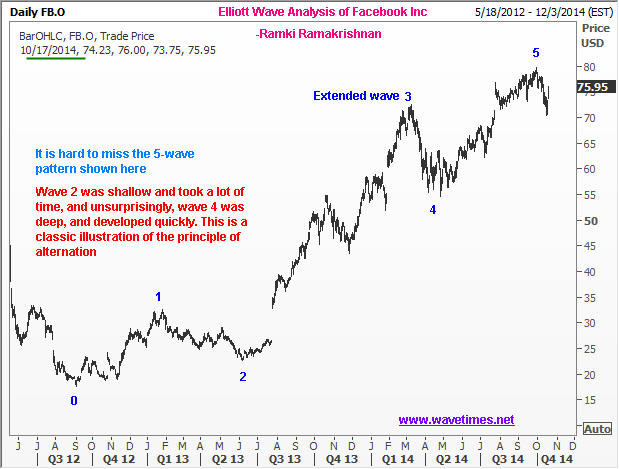
Interestingly, wave 2 took a lot of time in correcting the wave 1, but it went quite deep, just a shade over the 61.8% level. You will recognize that 61.8% is a pretty important Fibonacci Ratio. Now the key point here is this. Even as early as Q3 of 2013, you would have said to yourself that once the third wave develops, the next correction, namely, wave 4, would be deep and will happen relatively quickly. This is the principle of alternation. Please refer to FWTFF for more information on that, but there are many more examples in this free blog too.
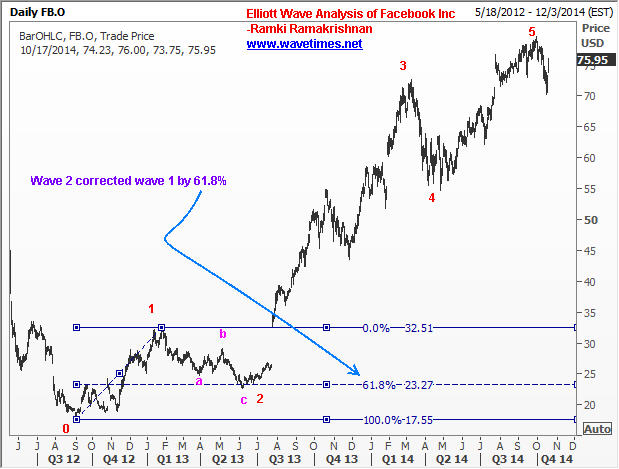
A smart investor would have been ready to buy Facebook as it rallied up from the 61.8% retracement because we were then in a 3rd wave. As many of you probably know, wave 3 of any impulse bull market is the strongest up move, and it also has the highest chance of becoming an extended wave. In the case of Facebook, its wave 3 went to a measure of 323.6% of wave 1, as shown in the next Elliott Wave chart.
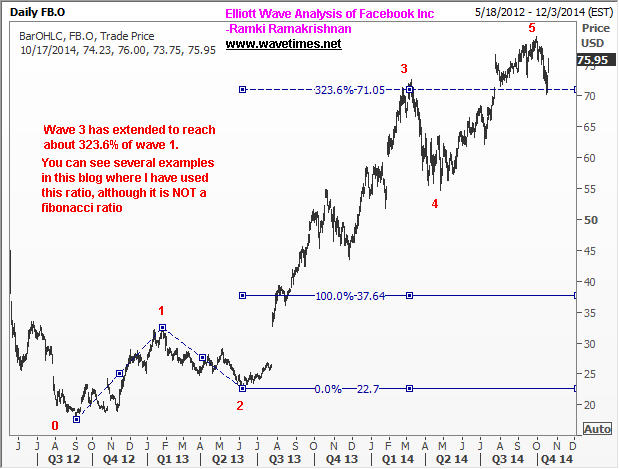
Now some of you might wonder about my use of 323.6% as this is not a ratio that has been discussed by Frost & Prechter. During my over 30-years of dealing with financial markets and experience with Elliott Waves over that time, I have seen this ratio often enough to include it in my offering to the fund of knowledge. You can find many more examples in Wavetimes.com.
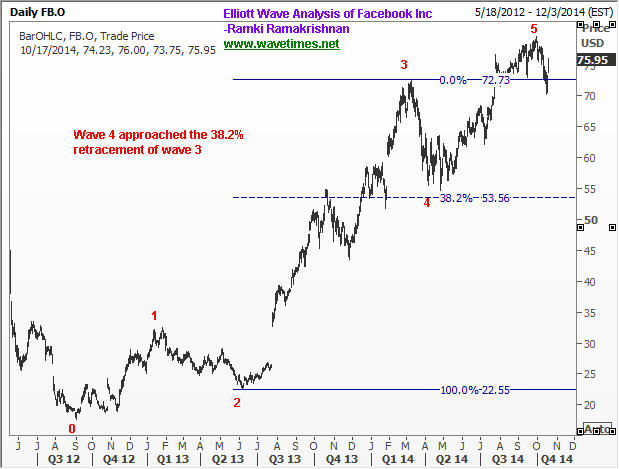
The main challenge for traders is to figure out WHERE an extended wave will end. Unfortunately, there is no certainty about that, and anyone who attempts to pick a top during an extending third wave is honestly asking for trouble. However, once the correction starts, in the case of Facebook, it was bound to be swift because, remember, wave 2 took long to develop! Take a look at the following Elliott Wave chart to see this.
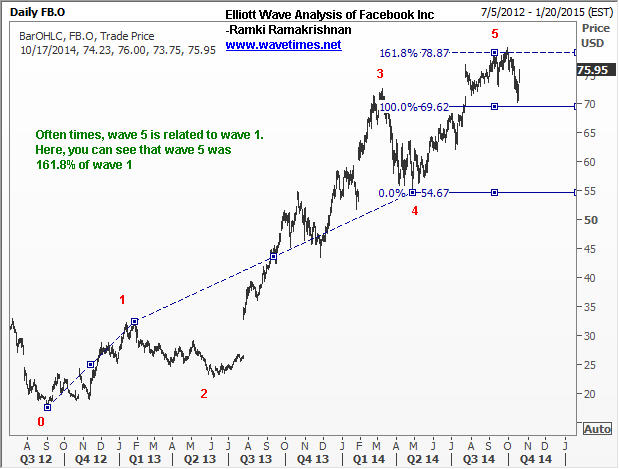
The final stages of the bull run begins with wave 5. As with all impulse waves, this wave 5 needs to have its own set of five sub waves, and incredibly, these sub waves are also related to each other quite like the waves of the larger degree. But first see how one could have anticipated the end of wave 5 by computing 161.8% measure of wave 1 and adding it to the bottom of wave 4.
And to add come confirmation, we can look at the relationships of the sub waves of wave 5 as shown below.
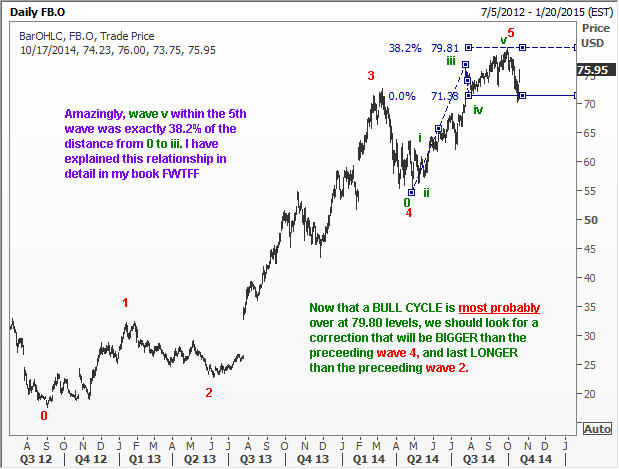
Now that I have shown you how to read a chart using the clues that Elliott Wave theory gives us, you should attempt to anticipate how the ensuing bear cycle will pan out. One clue I can give you is the correction will travel a distance greater than the larger of the two prior corrective waves. A second clue is the correction will take more time than wave 2 did. If you are an investor who is seeking to buy Facebook, it might be a good idea to focus on some other stock for the next several months while Facebook goes about its business of being moved back and forth by a fickle market. Eventually, it WILL come down by the measures discussed above and that is the right time to invest in this stock for its next bull run.
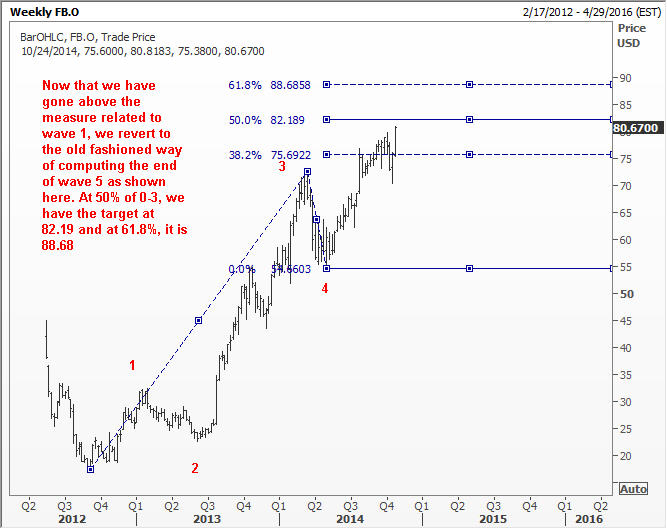
25 Oct 2014 UPDATE:
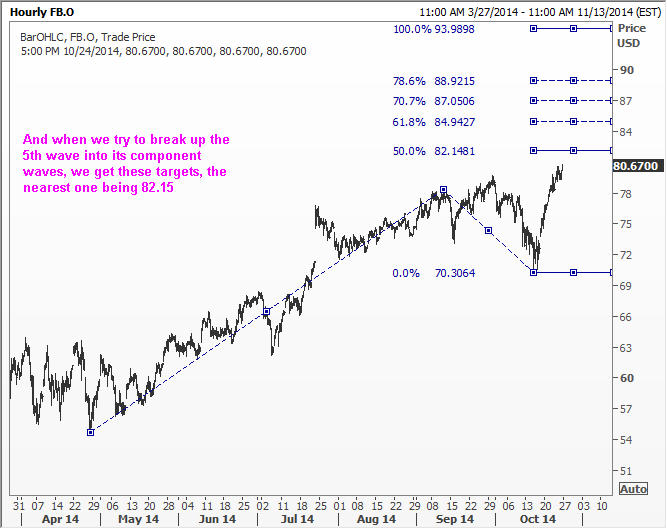
The recovery in the last few days to a new high has brought back the need to recompute the targets for the end of wave 5. Here are two more charts to guide you.
The goal of this blog is to share with you some of my experience and teach you how to use Elliott Waves. My other website, wavetimes.net, is where I discuss live trades.
