• About
  • Elliott Waves
    • Elliott Waves Explained
    • Elliott Wave Magic Illustrated with Wave Charts
    • Elliott Wave Edge – How Elliott Wave Traders Win
    • Fibonacci Number Series and Elliott Waves
    • How to use Fibonacci Ratio Retracements
    • Elliott Wave Books
      • The Elliott Wave Book – Five Waves to Financial Freedom
      • Dividend Growth Investing Using Elliott Waves
    • Videos
  • Equities
    • Indices
      • Africa
        • Egypt
      • Australia
      • European Indices
        • AEX – Index, Amsterdam
        • DAX Index
        • Istanbul
        • Russia
        • Spain’s IBEX 35
      • Asian Indices
        • India
        • China
        • Dubai
        • Kuwait
        • Kuala Lumpur
        • Pakistan
        • Saudi
        • Taiwan
      • US Indices
        • S&P500
        • Nasdaq
        • Dow Jones
        • Dow Jones Utilities
    • Stocks
      • Asian Stocks
        • Indian Stocks Trading
        • Dubai Stocks Outlook
        • Japanese Stocks
        • Kuwait stocks
        • Saudi Stocks Outlook
      • African Stocks
        • Egyptian Stocks
      • Swiss Stocks
      • Australian Stocks
      • European Stocks
      • US Stocks outlook
      • UK Stocks
  • Commodities
    • Copper
    • Gasoline
    • Gold
    • Natural Gas
    • Oil
    • Palm Oil
    • Raw Sugar
    • Rubber
    • Soybean Oil
    • Silver
  • Forex
    • AUD
    • Bitcoin
    • CAD
    • CHF
    • Euro
    • GBP
    • INR
    • NZD
    • JPY
  • Raves
  • Consulting
    • Consulting
  • Ramki’s Watchlist
Top News

Has Meta (Facebook) stock seen the bottom

March 21, 2022

What Is The Nearest Technical Support For Meta (NASDAQ: FB)

February 7, 2022

Using Elliott Waves to Capture a Trade in S&P500

January 27, 2022
Facebook Twitter Instagram
WaveTimes Blog WaveTimes Blog
Wave times
  • About
  • Elliott Waves
    • Elliott Waves Explained
    • Elliott Wave Magic Illustrated with Wave Charts
    • Elliott Wave Edge – How Elliott Wave Traders Win
    • Fibonacci Number Series and Elliott Waves
    • How to use Fibonacci Ratio Retracements
    • Elliott Wave Books
      • The Elliott Wave Book – Five Waves to Financial Freedom
      • Dividend Growth Investing Using Elliott Waves
    • Videos
  • Equities
    • Indices
      • Africa
        • Egypt
      • Australia
      • European Indices
        • AEX – Index, Amsterdam
        • DAX Index
        • Istanbul
        • Russia
        • Spain’s IBEX 35
      • Asian Indices
        • India
        • China
        • Dubai
        • Kuwait
        • Kuala Lumpur
        • Pakistan
        • Saudi
        • Taiwan
      • US Indices
        • S&P500
        • Nasdaq
        • Dow Jones
        • Dow Jones Utilities
    • Stocks
      • Asian Stocks
        • Indian Stocks Trading
        • Dubai Stocks Outlook
        • Japanese Stocks
        • Kuwait stocks
        • Saudi Stocks Outlook
      • African Stocks
        • Egyptian Stocks
      • Swiss Stocks
      • Australian Stocks
      • European Stocks
      • US Stocks outlook
      • UK Stocks
  • Commodities
    • Copper
    • Gasoline
    • Gold
    • Natural Gas
    • Oil
    • Palm Oil
    • Raw Sugar
    • Rubber
    • Soybean Oil
    • Silver
  • Forex
    • AUD
    • Bitcoin
    • CAD
    • CHF
    • Euro
    • GBP
    • INR
    • NZD
    • JPY
  • Raves
  • Consulting
    • Consulting
  • Ramki’s Watchlist
WaveTimes Blog WaveTimes Blog
Home » EURUSD update using Elliott Waves
Euro

EURUSD update using Elliott Waves

RamkiBy RamkiApril 5, 201217 Comments1 Min Read
Facebook Twitter LinkedIn Telegram Pinterest Tumblr Reddit WhatsApp Email
Share
Facebook Twitter LinkedIn Pinterest Email

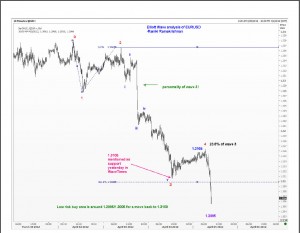
The EURUSD found support yesterday at 1.3105, quite precisely as anticipated using Elliott Wave analysis.(see yesterday’s outlook for the EURUSD). The recovery stopped at 1.3164 and the downmove has been aggressive. I think there exists a small chance for a clean out to 1.3005/1.2995 and if that happens, it should present us with a low risk buying level for the next few sessions, perhaps taking it back to 1.3160 after meeting some initial resistance at 1.3105 the prior low.
PS This analysis used a 10 minute chart, and clearly is meant for short term traders.

EUR/USD Euro
Share. Facebook Twitter Pinterest LinkedIn Tumblr Telegram Email
Previous ArticleElliott Wave update on EURUSD complex correction
Next Article Soybean outlook using Elliott Waves
Ramki
  • Website

Related Posts

How we traded EURJPY recently

October 23, 2019

An example of EURUSD analysis using Elliott Waves

May 8, 2018

What WaveTimes could do for you in EURUSD

May 8, 2017
View 17 Comments

17 Comments

  1. fiscal on April 5, 2012 5:03 am

    sir excellent analysis to help small traders. If you can work out something on a permanent basis.

    Reply
  2. KB on April 5, 2012 6:53 am

    Hi Ramki,
    If you look at wave 5 in your analysis,(the 10 min chart) in a 5 min chart, if you now look at the completed wave 5 of 5 of 5, it produced a perfect 61.8 of 0-3, even in this very low time frame the acknowledgement to Elliott & Fibonacci is astounding, but if people aren’t aware of this, and most aren’t why does it work so well, as you say there is simply no better way to trade/predict/manage freely traded financial markets. It’s as if price action is unable to leave/move outside of the mathematical grid.

    Reply
    • Ramki on April 5, 2012 7:45 am

      Hi KB, absolutely! I never cease to wonder at these beauties. From around 1.3205, it was possible to trade this move all the way to 1.3037 and some friends who spoke to me earlier lesrned of the 1.5037 well before it got there. The 1.3005 support is an outlier and would present a nice opportunity I thought. Let’s see. We have that and the 1.2953 mentioned yesterday to keep an eye on.

      Reply
  3. meyyappa on April 5, 2012 7:35 am

    dear sir thanks for ur guide , why u continue small traders like me for nifty trade

    Reply
  4. Dinesh Kumar Bohre on April 5, 2012 11:08 am

    Dear Ramki Sir,

    One question on corrective waves:

    Let’s say, wave 2 is a double flat correction: a1-b1-c1-x-a2-b2-c2

    And in this double flat, bottom of wave c1 is lowest (bottom of a2 & c2 are higher).

    Then, length of wave 3 start shoult be counted from bottom of c2 or bottom of c1 ?

    I have not found answer to this so far…

    Reply
    • Ramki on April 6, 2012 5:55 am

      Dinesh, Thanks for your comment. I measure it from the end of c2 if that is the final part of the correction.

      Reply
  5. fiscal on April 5, 2012 11:51 am

    sir is such analysis available for day traders on a regular basis? in case it is not feasible for you any other avenue? Your suggestion will be greatly appreciated.

    Reply
    • Ramki on April 6, 2012 5:53 am

      Fiscal, Sorry but I am not able to give daily updates on any instruments at present.

      Reply
  6. Shuchi on April 5, 2012 8:14 pm

    Dear Mr Ramki,
    I had been reading your Elliot wave analysis . Would you be able to guide me on USD INR looking into the charts and suggest what levels it can go upto in the short term and long term. Thanks a lot sir.

    Shuchi

    Reply
    • Ramki on April 6, 2012 5:58 am

      Hi Suchi, thanks for the comment, but I am not offering any trade recommendations on WaveTimes. The main goal is to offer you a chance to learn Elliott Wave analysis.Those who use WaveTimes as a source of trade ideas don’t know what adjustments I would make in real time depending on how the market unfolds.

      Reply
  7. Shuchi on April 6, 2012 8:16 am

    I just bought your book on my kindle. I had been reading charts of USD INR for my analysis. But not able to judge the wave well. I thought at the level of 54 wave 5 is over. So wanted to take your Analysis on it whether am I right in the readings or where is it heading Like the way you have mentioned about Euros move. I had been reading and trying to analyse INR since it had been so volatile from last six months. You have written article and given example of Euro and also yes bank in the Indian stock. It would be helpful if you can show chart Patters of rupee as well. I have seen other charts from different people in Bombay. But each of them no the chart differently.

    Reply
    • Ramki on April 6, 2012 8:39 am

      Hi Shuchi, The Indian rupee too can be analysed using EWP. Please see my old posts by looking it up under INR. I will write on it again sometime in the future. Thanks for your comments

      Reply
      • satya on April 18, 2012 9:52 pm

        Hi Ramki,
        USDINR touched about 51.94 and started receding a bit.
        I am one of the guys awaiting your update on USDINR.
        Hope you can make some time to look into this.
        Thank you,
        Satya

        Reply
        • Ramki on April 19, 2012 12:58 am

          Satya, I had a good resistance at 52.05/10

          Reply
  8. Fahad on April 8, 2012 8:28 am

    dear Ramki,
    its WOW!!
    I am really amazed, Saudi’s index fell rapidly from 7940 that point you have idetfied accurately in this post
    http://www.wavetimes.com/elliott-wave-analysis-of-saudi-arabias-tasi-index/
    the highest point is very clear thru this link:
    http://tinyurl.com/d52vfxo
    where the 52 week high is shown on 3 April 2012 at 7,930.58
    Can you please update the med & long term of saudi index?? please Ramki.

    Wow!

    Reply
  9. Luca on April 23, 2012 4:16 am

    I wander what is your opinion on EURUSD now.
    Do you still see EURUSD in wave B, correction of wave A?
    If so we should have had a and b completed and now we should see c up.

    Some other interpretations see EURUSD already in main wave C down, with 1 and 2 completed, and now in 2 of 3.

    What is your opinion? Many thanx.

    Reply
    • Ramki on April 24, 2012 6:22 am

      Hi Luca, As explained in my book, wave C has a personality that id different from what we are currently seeing. So on balance, I would be careful about being short. Having said that, if we get some event that can trigger a sell off, the Euro will just drop quickly. The longer it stays here, the greater the chances for a recovery first.

      Reply

Leave A Reply Cancel Reply

Recent Posts
  • Has Meta (Facebook) stock seen the bottom
  • What Is The Nearest Technical Support For Meta (NASDAQ: FB)
  • Using Elliott Waves to Capture a Trade in S&P500
  • Hedge Funds and Elliott Waves – Netflix $NFLX
  • When Elliott Waves applauds the promoter’s signals!

WaveTimes is a Research Organization dedicated to providing original analysis, reports, reviews, and insights on developments in mutual funds, stocks, investing, foreign exchange, commodities, and bonds.

Contact WaveTimes

L-601 Mantri Espana,

Kariyammana Agrahara, Bellandur, Bangalore 560103

Follow Us

  • Facebook
  • YouTube
  • Twitter

© 2022 Wave Times. All Rights Reserved.
  • About
  • Books
  • Privacy Policy
  • Policies and Standards

Type above and press Enter to search. Press Esc to cancel.