• About
  • Elliott Waves
    • Elliott Waves Explained
    • Elliott Wave Magic Illustrated with Wave Charts
    • Elliott Wave Edge – How Elliott Wave Traders Win
    • Fibonacci Number Series and Elliott Waves
    • How to use Fibonacci Ratio Retracements
    • Elliott Wave Books
      • The Elliott Wave Book – Five Waves to Financial Freedom
      • Dividend Growth Investing Using Elliott Waves
    • Videos
  • Equities
    • Indices
      • Africa
        • Egypt
      • Australia
      • European Indices
        • AEX – Index, Amsterdam
        • DAX Index
        • Istanbul
        • Russia
        • Spain’s IBEX 35
      • Asian Indices
        • India
        • China
        • Dubai
        • Kuwait
        • Kuala Lumpur
        • Pakistan
        • Saudi
        • Taiwan
      • US Indices
        • S&P500
        • Nasdaq
        • Dow Jones
        • Dow Jones Utilities
    • Stocks
      • Asian Stocks
        • Indian Stocks Trading
        • Dubai Stocks Outlook
        • Japanese Stocks
        • Kuwait stocks
        • Saudi Stocks Outlook
      • African Stocks
        • Egyptian Stocks
      • Swiss Stocks
      • Australian Stocks
      • European Stocks
      • US Stocks outlook
      • UK Stocks
  • Commodities
    • Copper
    • Gasoline
    • Gold
    • Natural Gas
    • Oil
    • Palm Oil
    • Raw Sugar
    • Rubber
    • Soybean Oil
    • Silver
  • Forex
    • AUD
    • Bitcoin
    • CAD
    • CHF
    • Euro
    • GBP
    • INR
    • NZD
    • JPY
  • Raves
  • Consulting
    • Consulting
  • Ramki’s Watchlist
Top News

Has Meta (Facebook) stock seen the bottom

March 21, 2022

What Is The Nearest Technical Support For Meta (NASDAQ: FB)

February 7, 2022

Using Elliott Waves to Capture a Trade in S&P500

January 27, 2022
Facebook Twitter Instagram
WaveTimes Blog WaveTimes Blog
Wave times
  • About
  • Elliott Waves
    • Elliott Waves Explained
    • Elliott Wave Magic Illustrated with Wave Charts
    • Elliott Wave Edge – How Elliott Wave Traders Win
    • Fibonacci Number Series and Elliott Waves
    • How to use Fibonacci Ratio Retracements
    • Elliott Wave Books
      • The Elliott Wave Book – Five Waves to Financial Freedom
      • Dividend Growth Investing Using Elliott Waves
    • Videos
  • Equities
    • Indices
      • Africa
        • Egypt
      • Australia
      • European Indices
        • AEX – Index, Amsterdam
        • DAX Index
        • Istanbul
        • Russia
        • Spain’s IBEX 35
      • Asian Indices
        • India
        • China
        • Dubai
        • Kuwait
        • Kuala Lumpur
        • Pakistan
        • Saudi
        • Taiwan
      • US Indices
        • S&P500
        • Nasdaq
        • Dow Jones
        • Dow Jones Utilities
    • Stocks
      • Asian Stocks
        • Indian Stocks Trading
        • Dubai Stocks Outlook
        • Japanese Stocks
        • Kuwait stocks
        • Saudi Stocks Outlook
      • African Stocks
        • Egyptian Stocks
      • Swiss Stocks
      • Australian Stocks
      • European Stocks
      • US Stocks outlook
      • UK Stocks
  • Commodities
    • Copper
    • Gasoline
    • Gold
    • Natural Gas
    • Oil
    • Palm Oil
    • Raw Sugar
    • Rubber
    • Soybean Oil
    • Silver
  • Forex
    • AUD
    • Bitcoin
    • CAD
    • CHF
    • Euro
    • GBP
    • INR
    • NZD
    • JPY
  • Raves
  • Consulting
    • Consulting
  • Ramki’s Watchlist
WaveTimes Blog WaveTimes Blog
Home » EURUSD chart revisited
Euro

EURUSD chart revisited

RamkiBy RamkiSeptember 18, 20111 Comment1 Min Read
Facebook Twitter LinkedIn Telegram Pinterest Tumblr Reddit WhatsApp Email
Share
Facebook Twitter LinkedIn Pinterest Email

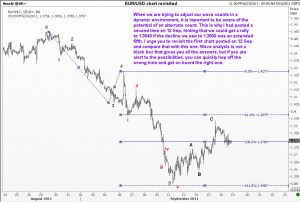
When we are trying to adjust our wave counts in a dynamic environment, it is important to be aware of the potential of an alternate count. This is why I had posted a second time on 12 Sep, hinting that we could get a rally to 1.3840 if the decline we saw to 1.3500 was an extended fifth. I urge you to revisit the first chart posted on 12 Sep and compare that with this one. Wave analysis is not a black box that gives you all the answers, but if you are alert to the possibilities, you can quickly hop off the wrong train and get on board the right one.
Typically, when we get an extended fifth wave, a recovery will be seen to wave ii of the fifth wave. However, extended fifth waves are also subject to a phenomenon known as a double retracement. (See my book Five Waves to Financial Freedom for details). We see that wave ii of the extended fifth lies above 1.4100. But given the current bearish stance, we might not get there directly. Don’t be surprised if we experience a deep pull back before the second retracement.

EUR/USD
Share. Facebook Twitter Pinterest LinkedIn Tumblr Telegram Email
Previous ArticleAdditional Chart of EURUSD
Next Article Elliott Wave Update for the Dow
Ramki
  • Website

Related Posts

How we traded EURJPY recently

October 23, 2019

An example of EURUSD analysis using Elliott Waves

May 8, 2018

What WaveTimes could do for you in EURUSD

May 8, 2017
View 1 Comment

1 Comment

  1. Yan on September 21, 2011 2:00 pm

    Evening Sir,

    This is what I think Euro is doing, 4hrs chart: http://screencast.com/t/1xJa6Emh7YK

    I think it has just started the 5th wave today. according to your book, wave 2 was simple and shallow, so wave 4 should be complex and deep on retrace. If this wave count is correct, then because neither wave 1 or wave 3 has extended, so the 5th wave should in theory extend. please see the below

    Here is the daily chart, http://screencast.com/t/obztOl9M

    working in the C wave of a flat ABC, so if wave 5= 0.764*(distance from 0 to end of wave 3), it coincides with wave C=1.382*A measuring from the beginning of wave B.

    Alternately, the entire C wave on the chart can be a zigzag, from 0 to wave 3 is actually 5 waves(same to your wave count) and the 4th wave is abc, and 5th wave is another five waves.
    ————-

    Also just like to say, your book is amazing, after read your book, some part I read a few times, my trading result has improved a lot, I am now more confident when taking trade which on the other hand helped me on the trading psychology, it made everything falling into places for me really. A Big Thank You.

    Yan

    Reply

Leave A Reply Cancel Reply

Recent Posts
  • Has Meta (Facebook) stock seen the bottom
  • What Is The Nearest Technical Support For Meta (NASDAQ: FB)
  • Using Elliott Waves to Capture a Trade in S&P500
  • Hedge Funds and Elliott Waves – Netflix $NFLX
  • When Elliott Waves applauds the promoter’s signals!

WaveTimes is a Research Organization dedicated to providing original analysis, reports, reviews, and insights on developments in mutual funds, stocks, investing, foreign exchange, commodities, and bonds.

Contact WaveTimes

L-601 Mantri Espana,

Kariyammana Agrahara, Bellandur, Bangalore 560103

Follow Us

  • Facebook
  • YouTube
  • Twitter

© 2023 Wave Times. All Rights Reserved.
  • About
  • Books
  • Privacy Policy
  • Policies and Standards

Type above and press Enter to search. Press Esc to cancel.