(Please read important update at the end of this post)
Ever so often, Elliott Waves helps the investor from making mistakes. For example, when I read the news that Rakesh Jhunjhunwala, the ace investor,had increased his position in Polaris, I decided to see what Elliott Waves had to say. Sure enough, it warned against following the Badshah this time.
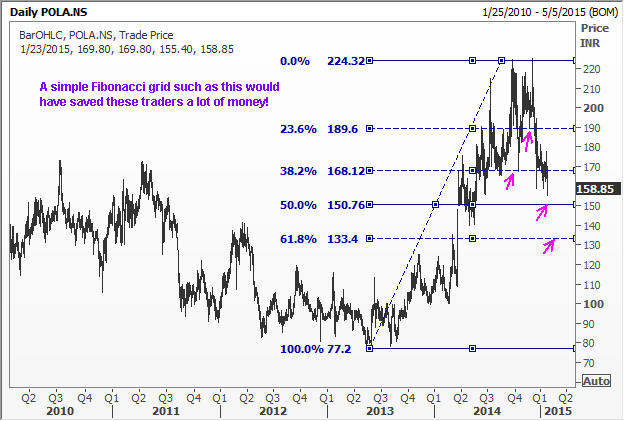
Many investors don’t even read the news fully. Here are the headlines, and the final paragraph from the Economic Times.

Maybe I am reading this news all wrong, and he actually made fresh investments just the previous day! But it was essential to see what Elliott Wave analysis would say. Here are a couple of charts.
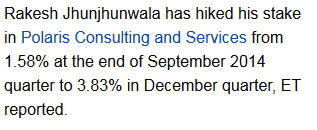
As you can see from the Elliott Wave chart above, Polaris Consulting has already completed a five wave rally near the highs, and the fifth wave was 38.2% of the distance from point ‘0’ to point ‘3’. Many of you are familiar with this approach to anticipating where a fifth wave will end. I have also explained this in detail in my Elliott Wave book, ‘Five Waves to Financial Freedom“.
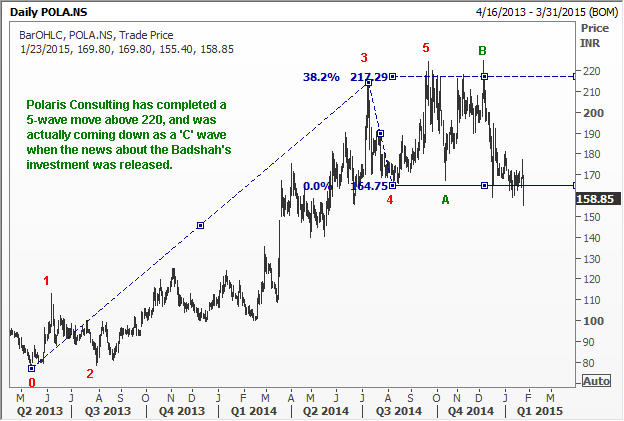
The next Elliott Wave chart shows how the correction is unfolding. As you know, once a five wave upmove is completed, we will get a three wave correction. And the most powerful of the three waves down will be the ‘C’ Wave. It is clear that Polaris is in the middle of such a ‘C’ wave.
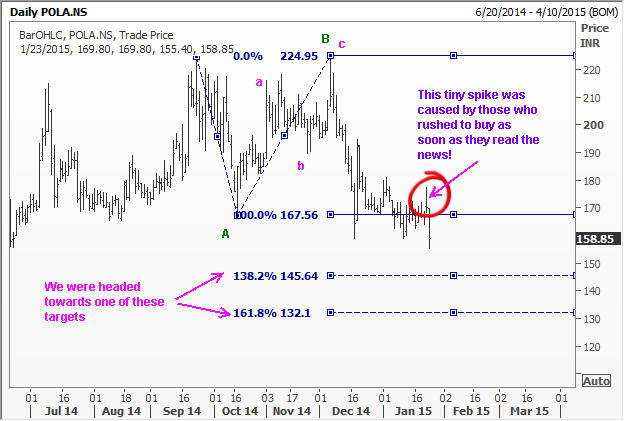
It is also useful to look at some Fibonacci retracements as shown in the next Elliott Wave chart. You can see that Polaris had paused briefly at a couple of prior Fibonacci retracement levels on the way down, but clearly, it shouldn’t appeal to any Elliott Wave trader to be blindly following the Polaris News.
IMPORTANT UPDATE:23 Jan 2014: I have heard back from some WaveTimes members that I have not taken into account the fact that Polaris has demerged with “Intellect Design Arena”, and that stock has its own value, and hence it is incorrect to say that investors in Polaris who purchased the stock in the last two days have made a mistake. I am indeed guilty of not knowing this development. However, I did take care to check if there was any news about Polaris that caused it to reverse exactly one day after the news I referred to above. There wasn’t! This merger has been in the news much earlier. The stock has simply adjusted lower today. This should give us pause to think about a company that has a stock split.The chart of a stock that has been split is immediately adjusted historically. But in the case of a demerger, where a portion of the company is separated, how do we treat that stock? What is the value of the demerged entity 1 year ago, 2 years ago? If you know the answer, please post in the comments area.
