Elliott Waves is a great tool to have when you are deciding which way the market is more likely to go. You will then be able to evaluate the risks and figure out a low-risk entry point for your trade.
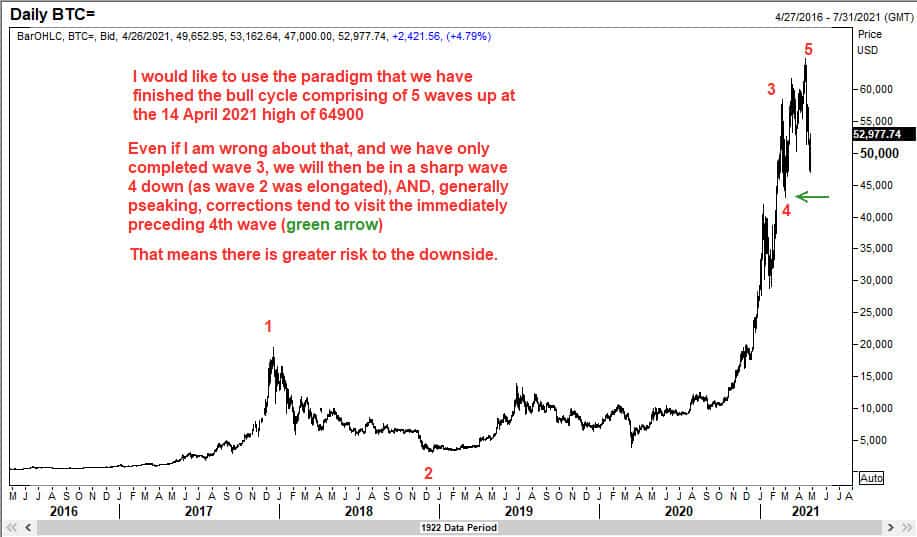
Below is a chart that I shared with my consulting client on 26th April 2021. At that time Bitcoin was trading around 53,000. Just in the preceding few sessions, BTC/USD had rallied pretty quickly from 47,000 to 53,000. So, my analysis suggested that we could go higher towards 56,000 and what happened there will determine whether we go down to 43000 in a bearish wave down, or whether we should consider positioning for further upside after a correction down. I had asked him to watch the speed of the move at the end of this upswing to decide whether he should choose to be short for the sell off to 43000. The climb slowed down, and although we tested 59,000 several times, we never closed above it except on one session (59,009 was the high that day).
Elliott Waves anticipated the sell off to 43000 days in advance. You too could have taken advantage of such moves. You could either take my online Elliott Wave Course, and learn the tools of the trade, or simply become a member of my exclusive club and approach me for a consultation.
Here is the first chart of that analysis, where I laid down the framework.