• About
  • Elliott Waves
    • Elliott Waves Explained
    • Elliott Wave Magic Illustrated with Wave Charts
    • Elliott Wave Edge – How Elliott Wave Traders Win
    • Fibonacci Number Series and Elliott Waves
    • How to use Fibonacci Ratio Retracements
    • Elliott Wave Books
      • The Elliott Wave Book – Five Waves to Financial Freedom
      • Dividend Growth Investing Using Elliott Waves
    • Videos
  • Equities
    • Indices
      • Africa
        • Egypt
      • Australia
      • European Indices
        • AEX – Index, Amsterdam
        • DAX Index
        • Istanbul
        • Russia
        • Spain’s IBEX 35
      • Asian Indices
        • India
        • China
        • Dubai
        • Kuwait
        • Kuala Lumpur
        • Pakistan
        • Saudi
        • Taiwan
      • US Indices
        • S&P500
        • Nasdaq
        • Dow Jones
        • Dow Jones Utilities
    • Stocks
      • Asian Stocks
        • Indian Stocks Trading
        • Dubai Stocks Outlook
        • Japanese Stocks
        • Kuwait stocks
        • Saudi Stocks Outlook
      • African Stocks
        • Egyptian Stocks
      • Swiss Stocks
      • Australian Stocks
      • European Stocks
      • US Stocks outlook
      • UK Stocks
  • Commodities
    • Copper
    • Gasoline
    • Gold
    • Natural Gas
    • Oil
    • Palm Oil
    • Raw Sugar
    • Rubber
    • Soybean Oil
    • Silver
  • Forex
    • AUD
    • Bitcoin
    • CAD
    • CHF
    • Euro
    • GBP
    • INR
    • NZD
    • JPY
  • Raves
  • Consulting
    • Consulting
  • Ramki’s Watchlist
Top News

Has Meta (Facebook) stock seen the bottom

March 21, 2022

What Is The Nearest Technical Support For Meta (NASDAQ: FB)

February 7, 2022

Using Elliott Waves to Capture a Trade in S&P500

January 27, 2022
Facebook Twitter Instagram
WaveTimes Blog WaveTimes Blog
Wave times
  • About
  • Elliott Waves
    • Elliott Waves Explained
    • Elliott Wave Magic Illustrated with Wave Charts
    • Elliott Wave Edge – How Elliott Wave Traders Win
    • Fibonacci Number Series and Elliott Waves
    • How to use Fibonacci Ratio Retracements
    • Elliott Wave Books
      • The Elliott Wave Book – Five Waves to Financial Freedom
      • Dividend Growth Investing Using Elliott Waves
    • Videos
  • Equities
    • Indices
      • Africa
        • Egypt
      • Australia
      • European Indices
        • AEX – Index, Amsterdam
        • DAX Index
        • Istanbul
        • Russia
        • Spain’s IBEX 35
      • Asian Indices
        • India
        • China
        • Dubai
        • Kuwait
        • Kuala Lumpur
        • Pakistan
        • Saudi
        • Taiwan
      • US Indices
        • S&P500
        • Nasdaq
        • Dow Jones
        • Dow Jones Utilities
    • Stocks
      • Asian Stocks
        • Indian Stocks Trading
        • Dubai Stocks Outlook
        • Japanese Stocks
        • Kuwait stocks
        • Saudi Stocks Outlook
      • African Stocks
        • Egyptian Stocks
      • Swiss Stocks
      • Australian Stocks
      • European Stocks
      • US Stocks outlook
      • UK Stocks
  • Commodities
    • Copper
    • Gasoline
    • Gold
    • Natural Gas
    • Oil
    • Palm Oil
    • Raw Sugar
    • Rubber
    • Soybean Oil
    • Silver
  • Forex
    • AUD
    • Bitcoin
    • CAD
    • CHF
    • Euro
    • GBP
    • INR
    • NZD
    • JPY
  • Raves
  • Consulting
    • Consulting
  • Ramki’s Watchlist
WaveTimes Blog WaveTimes Blog
Home » Elliott Wave update on Nestle India
Indian Stocks Trading

Elliott Wave update on Nestle India

RamkiBy RamkiJuly 17, 201212 Comments1 Min Read
Facebook Twitter LinkedIn Telegram Pinterest Tumblr Reddit WhatsApp Email
Share
Facebook Twitter LinkedIn Pinterest Email

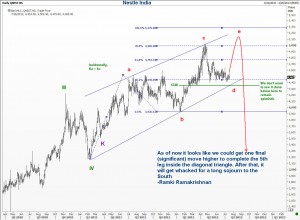
Elliott Wave Analysis of Nestle India
Nestle India has been one of those steady performers in the long run. However, the long-term investor needs to take note of a potential diagonal triangle in the fifth wave position. As explained in my book Five waves to Financial Freedom, a diagonal triangle at the fifth wave is a powerful signal. Now you should be aware that we are still in the process of making this formation, or in other words, that formation is only in my head. If we do get the final ‘e’ wave in Nestle India, that will travel quite a distance, and the investor will have lots of time to figure out where to exit the stock. What we dont want to see now is a close below 4340. Will someone please remind me in a few months where Nestle India has been between now and then!

Nestle India
Share. Facebook Twitter Pinterest LinkedIn Tumblr Telegram Email
Previous ArticleElliott Wave Update EURUSD ~ 11July 2012~ Marketwatch
Next Article Elliott Wave Commentary on "Reliance Communications Ltd"
Ramki
  • Website

Related Posts

When Elliott Waves applauds the promoter’s signals!

January 3, 2022

A soft quarter for TCS – Avoid or Add – Contd.

October 13, 2021

A soft quarter for TCS — Avoid or add?

October 12, 2021
View 12 Comments

12 Comments

  1. meyah on July 18, 2012 12:43 am

    Dear

    In your chart, your used a new mark “K” , what does it mean?

    Reply
    • Ramki Ramakrishnan on July 18, 2012 2:42 am

      Hi Meyah, it means nothing special. I just randomly picked that letter to mark that low.

      Reply
  2. drsanjaypote on July 18, 2012 5:58 am

    Dear Ramki, I would be pleased to remind you of the price of Nestle in about a month.
    I would like to discuss the alternate count as follows:
    Nestle has finished its 5th wave at 5024 and started its ABC correction from there.
    Larger wave A might have finished at 4401.
    Larger wave B is forming a contracting Triangle with internal waves a,b, c, d,e.
    Int wave a ended at 4750, b at 4421, c at 4640, d at 4419 and e is ongoing which will end at approximately 4605-4625.
    Larger wave C will then correct down.
    Pl correct me if I am wrong.
    Thanks and Regards.

    Reply
    • Ramki Ramakrishnan on July 18, 2012 10:47 am

      Hi Dr Sanjay, all wave counts are work-in-progress, and no count is confirmed until the move is over. With that in mind, you should feel comfortable with your own count so long as no EWP rule is violated. Good luck.

      Reply
  3. RainMaker on July 18, 2012 9:45 pm

    Sir,

    (i) ka = kb
    what is the significance ? What inferences can we draw from the given fact ?

    (ii) Closing below 4340.
    It kind of a confirms the ongoing formation of diagonal triangle.
    If it does not happens so then recount b-c as 1-2-3 –
    Am I right sir in my understanding

    (iii)If it does not happens so then recount b-c as 1-2-3 – start of a new impulsive wave.

    Reply
    • Ramki Ramakrishnan on July 18, 2012 10:14 pm

      Hi Rainmaker, the significance of ka=bc (not ka=kb)is the outside chance that the whole 5 wave move is already over and we will get the close below 4340 directly. However, I give that a low probability.

      Reply
  4. Teresa Chan on July 23, 2012 9:28 pm

    Dear Ramki, I read your analysis of Elliot Wave Chart with great interest. Could you please do an Elliot Wave analysis for Australian market ASX200, code XJO. Thanks, Teresa

    Reply
  5. Parimal Devnath on August 4, 2012 9:40 pm

    Hi Ramki Sir
    i am following the price of Nestle and RCOM. just to inform you, Nestle has closed at 4370 which is very close to your level of 4340. shall certainly tell you if it slides below your level.
    thanks and regards

    Reply
    • Ramki Ramakrishnan on August 5, 2012 12:32 am

      Parimal, Thank you. I am more interested ion RCOM around 44!

      Reply
  6. Parimal Devnath on August 5, 2012 8:21 am

    Hello Ramki Sir
    certainly intimate you RCOM at 44
    thanks, with kind regards

    Reply
  7. rohit on September 3, 2012 9:26 am

    though i dont like elliot wave analysis as its too vague a concept, i found your analysis worth reading. ur honest in ur approach unlike others. i admire u for that & i am proud 2b an indian.

    but nestle is not in F&O, so even if it falls, its of no use till it reaches its bottom from where we can pick it up. so how this analysis will help us?

    Reply
    • Ramki Ramakrishnan on September 3, 2012 9:52 pm

      Rohit, thanks for the comments. Wavetimes is designed to teach elliott waves. Once you learn the methods, you can apply it to any instrument, not just Nestle stock. good luck

      Reply

Leave A Reply Cancel Reply

Recent Posts
  • Has Meta (Facebook) stock seen the bottom
  • What Is The Nearest Technical Support For Meta (NASDAQ: FB)
  • Using Elliott Waves to Capture a Trade in S&P500
  • Hedge Funds and Elliott Waves – Netflix $NFLX
  • When Elliott Waves applauds the promoter’s signals!

WaveTimes is a Research Organization dedicated to providing original analysis, reports, reviews, and insights on developments in mutual funds, stocks, investing, foreign exchange, commodities, and bonds.

Contact WaveTimes

L-601 Mantri Espana,

Kariyammana Agrahara, Bellandur, Bangalore 560103

Follow Us

  • Facebook
  • YouTube
  • Twitter

© 2023 Wave Times. All Rights Reserved.
  • About
  • Books
  • Privacy Policy
  • Policies and Standards

Type above and press Enter to search. Press Esc to cancel.