• About
  • Elliott Waves
    • Elliott Waves Explained
    • Elliott Wave Magic Illustrated with Wave Charts
    • Elliott Wave Edge – How Elliott Wave Traders Win
    • Fibonacci Number Series and Elliott Waves
    • How to use Fibonacci Ratio Retracements
    • Elliott Wave Books
      • The Elliott Wave Book – Five Waves to Financial Freedom
      • Dividend Growth Investing Using Elliott Waves
    • Videos
  • Equities
    • Indices
      • Africa
        • Egypt
      • Australia
      • European Indices
        • AEX – Index, Amsterdam
        • DAX Index
        • Istanbul
        • Russia
        • Spain’s IBEX 35
      • Asian Indices
        • India
        • China
        • Dubai
        • Kuwait
        • Kuala Lumpur
        • Pakistan
        • Saudi
        • Taiwan
      • US Indices
        • S&P500
        • Nasdaq
        • Dow Jones
        • Dow Jones Utilities
    • Stocks
      • Asian Stocks
        • Indian Stocks Trading
        • Dubai Stocks Outlook
        • Japanese Stocks
        • Kuwait stocks
        • Saudi Stocks Outlook
      • African Stocks
        • Egyptian Stocks
      • Swiss Stocks
      • Australian Stocks
      • European Stocks
      • US Stocks outlook
      • UK Stocks
  • Commodities
    • Copper
    • Gasoline
    • Gold
    • Natural Gas
    • Oil
    • Palm Oil
    • Raw Sugar
    • Rubber
    • Soybean Oil
    • Silver
  • Forex
    • AUD
    • Bitcoin
    • CAD
    • CHF
    • Euro
    • GBP
    • INR
    • NZD
    • JPY
  • Raves
  • Consulting
    • Consulting
  • Ramki’s Watchlist
Top News

Has Meta (Facebook) stock seen the bottom

March 21, 2022

What Is The Nearest Technical Support For Meta (NASDAQ: FB)

February 7, 2022

Using Elliott Waves to Capture a Trade in S&P500

January 27, 2022
Facebook Twitter Instagram
WaveTimes Blog WaveTimes Blog
Wave times
  • About
  • Elliott Waves
    • Elliott Waves Explained
    • Elliott Wave Magic Illustrated with Wave Charts
    • Elliott Wave Edge – How Elliott Wave Traders Win
    • Fibonacci Number Series and Elliott Waves
    • How to use Fibonacci Ratio Retracements
    • Elliott Wave Books
      • The Elliott Wave Book – Five Waves to Financial Freedom
      • Dividend Growth Investing Using Elliott Waves
    • Videos
  • Equities
    • Indices
      • Africa
        • Egypt
      • Australia
      • European Indices
        • AEX – Index, Amsterdam
        • DAX Index
        • Istanbul
        • Russia
        • Spain’s IBEX 35
      • Asian Indices
        • India
        • China
        • Dubai
        • Kuwait
        • Kuala Lumpur
        • Pakistan
        • Saudi
        • Taiwan
      • US Indices
        • S&P500
        • Nasdaq
        • Dow Jones
        • Dow Jones Utilities
    • Stocks
      • Asian Stocks
        • Indian Stocks Trading
        • Dubai Stocks Outlook
        • Japanese Stocks
        • Kuwait stocks
        • Saudi Stocks Outlook
      • African Stocks
        • Egyptian Stocks
      • Swiss Stocks
      • Australian Stocks
      • European Stocks
      • US Stocks outlook
      • UK Stocks
  • Commodities
    • Copper
    • Gasoline
    • Gold
    • Natural Gas
    • Oil
    • Palm Oil
    • Raw Sugar
    • Rubber
    • Soybean Oil
    • Silver
  • Forex
    • AUD
    • Bitcoin
    • CAD
    • CHF
    • Euro
    • GBP
    • INR
    • NZD
    • JPY
  • Raves
  • Consulting
    • Consulting
  • Ramki’s Watchlist
WaveTimes Blog WaveTimes Blog
Home » Elliott Wave update on EURUSD complex correction
Euro

Elliott Wave update on EURUSD complex correction

RamkiBy RamkiApril 4, 2012Updated:January 22, 20225 Comments1 Min Read
Facebook Twitter LinkedIn Telegram Pinterest Tumblr Reddit WhatsApp Email
Share
Facebook Twitter LinkedIn Pinterest Email

My comments on MarketWatch a few days ago seems an understatement. No matter how fancy your charts are, and how imagiative you could be with attempting to figure out in advance how a complex correction will unfold, you are simpply shooting in the dark. This is why I went to great lengths to explain that whatever I have shown you on the chart last time could all be wrong. In a complex correction we should expect the unexpected. Trading a complex correction should be strictly for those with deep pockets and quick access to the markets.
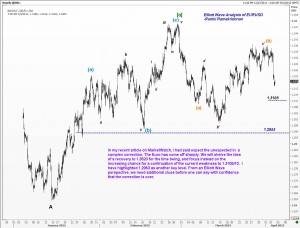
I am presenting you with another chart, where I have made only a minor change to the count. Instead of the ‘X’ at 1.3002, I have placed a “b'”, which allows me to see a dip down to 1.3105 initially. We could later on go lower still to 1.2953, but I don’t want to discuss that before we see what happens at 1.3105.

Stay tuned! This is your live lesson on how to deal with complex corrections.

complex correction EUR/USD Euro
Share. Facebook Twitter Pinterest LinkedIn Tumblr Telegram Email
Previous ArticlePrepare for the unexpected in EUR/USD
Next Article EURUSD update using Elliott Waves
Ramki
  • Website

Related Posts

How we traded EURJPY recently

October 23, 2019

An example of EURUSD analysis using Elliott Waves

May 8, 2018

What WaveTimes could do for you in EURUSD

May 8, 2017
View 5 Comments

5 Comments

  1. KB on April 4, 2012 2:48 am

    Hi Ramki,
    Some very true points yet again in your analysis, but should people trade EUR/USD without consideration for the $dxy, which paints a different picture, with the index having just “looking” to have completed an irregular correction, with “c” 2.618 of “A” so we should now see a strong rally in the $dxy, sharp decline in EUR/USD, the recent swings of which are 824 pips or fibonacci ratios thereoff, the next of which would be 2.618 giving a low of 1.18342 , the last rally was 824, “your X” was 824 by 123.6, as you say, lets wait and see what unfolds,
    Also just wanted to say, I enjoyed your book very much,
    Regards

    Reply
  2. fiscal on April 4, 2012 8:06 am

    sir went your way. keep it up. I don’t think anybody can challenge your analysis.
    now that it has bouning back if you can post an update?

    Reply
  3. PB on April 4, 2012 8:53 pm

    Thanks, it great to see how you count a complex correction like that.
    Would you explain how you arrived at the 1.3105 level?

    Reply
    • Ramki on April 4, 2012 9:50 pm

      Hi PB, Thanks. Complex corrections are hard for even the experienced, and is best left alone most of the times.

      Reply
  4. goteno on April 4, 2012 11:46 pm

    Hi Ramki
    I am so confused with my Gold trading now.
    Could you give us some analysis on Gold at your spare time.
    Your hard work would be highly appreciated

    Reply

Leave A Reply Cancel Reply

Recent Posts
  • Has Meta (Facebook) stock seen the bottom
  • What Is The Nearest Technical Support For Meta (NASDAQ: FB)
  • Using Elliott Waves to Capture a Trade in S&P500
  • Hedge Funds and Elliott Waves – Netflix $NFLX
  • When Elliott Waves applauds the promoter’s signals!

WaveTimes is a Research Organization dedicated to providing original analysis, reports, reviews, and insights on developments in mutual funds, stocks, investing, foreign exchange, commodities, and bonds.

Contact WaveTimes

L-601 Mantri Espana,

Kariyammana Agrahara, Bellandur, Bangalore 560103

Follow Us

  • Facebook
  • YouTube
  • Twitter

© 2023 Wave Times. All Rights Reserved.
  • About
  • Books
  • Privacy Policy
  • Policies and Standards

Type above and press Enter to search. Press Esc to cancel.