• About
  • Elliott Waves
    • Elliott Waves Explained
    • Elliott Wave Magic Illustrated with Wave Charts
    • Elliott Wave Edge – How Elliott Wave Traders Win
    • Fibonacci Number Series and Elliott Waves
    • How to use Fibonacci Ratio Retracements
    • Elliott Wave Books
      • The Elliott Wave Book – Five Waves to Financial Freedom
      • Dividend Growth Investing Using Elliott Waves
    • Videos
  • Equities
    • Indices
      • Africa
        • Egypt
      • Australia
      • European Indices
        • AEX – Index, Amsterdam
        • DAX Index
        • Istanbul
        • Russia
        • Spain’s IBEX 35
      • Asian Indices
        • India
        • China
        • Dubai
        • Kuwait
        • Kuala Lumpur
        • Pakistan
        • Saudi
        • Taiwan
      • US Indices
        • S&P500
        • Nasdaq
        • Dow Jones
        • Dow Jones Utilities
    • Stocks
      • Asian Stocks
        • Indian Stocks Trading
        • Dubai Stocks Outlook
        • Japanese Stocks
        • Kuwait stocks
        • Saudi Stocks Outlook
      • African Stocks
        • Egyptian Stocks
      • Swiss Stocks
      • Australian Stocks
      • European Stocks
      • US Stocks outlook
      • UK Stocks
  • Commodities
    • Copper
    • Gasoline
    • Gold
    • Natural Gas
    • Oil
    • Palm Oil
    • Raw Sugar
    • Rubber
    • Soybean Oil
    • Silver
  • Forex
    • AUD
    • Bitcoin
    • CAD
    • CHF
    • Euro
    • GBP
    • INR
    • NZD
    • JPY
  • Raves
  • Consulting
    • Consulting
  • Ramki’s Watchlist
Top News

Has Meta (Facebook) stock seen the bottom

March 21, 2022

What Is The Nearest Technical Support For Meta (NASDAQ: FB)

February 7, 2022

Using Elliott Waves to Capture a Trade in S&P500

January 27, 2022
Facebook Twitter Instagram
WaveTimes Blog WaveTimes Blog
Wave times
  • About
  • Elliott Waves
    • Elliott Waves Explained
    • Elliott Wave Magic Illustrated with Wave Charts
    • Elliott Wave Edge – How Elliott Wave Traders Win
    • Fibonacci Number Series and Elliott Waves
    • How to use Fibonacci Ratio Retracements
    • Elliott Wave Books
      • The Elliott Wave Book – Five Waves to Financial Freedom
      • Dividend Growth Investing Using Elliott Waves
    • Videos
  • Equities
    • Indices
      • Africa
        • Egypt
      • Australia
      • European Indices
        • AEX – Index, Amsterdam
        • DAX Index
        • Istanbul
        • Russia
        • Spain’s IBEX 35
      • Asian Indices
        • India
        • China
        • Dubai
        • Kuwait
        • Kuala Lumpur
        • Pakistan
        • Saudi
        • Taiwan
      • US Indices
        • S&P500
        • Nasdaq
        • Dow Jones
        • Dow Jones Utilities
    • Stocks
      • Asian Stocks
        • Indian Stocks Trading
        • Dubai Stocks Outlook
        • Japanese Stocks
        • Kuwait stocks
        • Saudi Stocks Outlook
      • African Stocks
        • Egyptian Stocks
      • Swiss Stocks
      • Australian Stocks
      • European Stocks
      • US Stocks outlook
      • UK Stocks
  • Commodities
    • Copper
    • Gasoline
    • Gold
    • Natural Gas
    • Oil
    • Palm Oil
    • Raw Sugar
    • Rubber
    • Soybean Oil
    • Silver
  • Forex
    • AUD
    • Bitcoin
    • CAD
    • CHF
    • Euro
    • GBP
    • INR
    • NZD
    • JPY
  • Raves
  • Consulting
    • Consulting
  • Ramki’s Watchlist
WaveTimes Blog WaveTimes Blog
Home » Elliott Wave update on Crude Oil 12 Dec 2011
Oil

Elliott Wave update on Crude Oil 12 Dec 2011

RamkiBy RamkiDecember 12, 201110 Comments1 Min Read
Facebook Twitter LinkedIn Telegram Pinterest Tumblr Reddit WhatsApp Email
Share
Facebook Twitter LinkedIn Pinterest Email

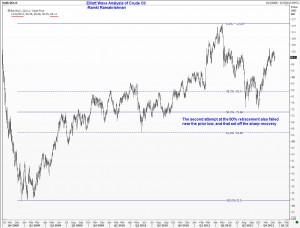
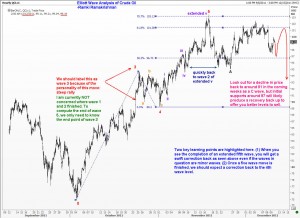
Crude Oil charts are showing tentative signs of fatigue after the run up from $74.95 to $103.37, a move of almost 38%. I am anticipating a correction back to around the $91 levels, but we need to be patient as there will likely be one more attempt higher first. Crude Oil traders need to keep a close watch going forward to see if we first get a dip to around $97 followed by a move back towards $103. If we get these moves, then the time to sell will be on any dip under $100 AFTER reaching 103. Your stops can then be placed above the high seen. This way you will be able to get an attractive risk-reward for the trade.

Elliott wave comments are given on the two charts you see here. As always, every update you see in WaveTimes is an opportunity to learn and reinforce your understanding the Elliott Wave Principle.

crudeoil Oil
Share. Facebook Twitter Pinterest LinkedIn Tumblr Telegram Email
Previous ArticleElliott Wave Comments on Gold outlook
Next Article Elliott Wave Analysis of Deutsche Bank
Ramki
  • Website

Related Posts

Crude Oil & Brent Crude Outlook: Can I get more wrong than this?

July 1, 2012

Elliott Wave Outlook for Brent Crude

June 26, 2012

Crude Oil Still Has Another 10% Price Drop In The Well

June 25, 2012
View 10 Comments

10 Comments

  1. Dinesh on December 13, 2011 5:33 am

    Dear Sir,

    Could you please provide reason why the price should touch $101 before a steep downfall.

    Interestingly, today itself the price touched around $97.60 and now up at $98.30 !!

    Reply
    • Ramki on December 13, 2011 6:16 am

      Hi DInesh, When dealing with a complex correction one has to use a bit of imagination, and this comes with experience. I could be wrong there, but what matters is the direction in the bigger picture, not the small squiggles on the way.

      Reply
      • Dinesh Kumar Bohre on December 14, 2011 11:44 am

        Dear Sir,

        I must congratulate you on this timely prediction.

        It was precise, first down to around 97.6 and then up to around 101.26 and now it touched 95.5 – barely within 48 hours of your post of this blog.

        The price must have asked you when to go up and till what level and then when to go down and till what level 🙂

        Reply
        • Ramki on December 15, 2011 1:38 am

          Dinesh/Sam and others.. thanks, and I am glad you made money. But remember, I am only sharing my knowledge, and you should not think my trade ideas will always be so spectacular.

          Reply
  2. salahudin ayubi on December 13, 2011 7:48 am

    Simply amazing Ramki!!

    Am watching oil fly past 100 at market open on 13 Dec and following your road map exactly….. WOW!!

    Reply
  3. Sam on December 13, 2011 10:24 am

    Wow

    Simply Great sir , today hit 101 range

    Reply
  4. Sam on December 14, 2011 12:16 pm

    Hello sir

    wow , I am unbelievable…….I got lot of money from your Post, thanks so much sir …………..

    Reply
  5. prithvi on December 21, 2011 8:43 am

    Dear Ramki Sir,

    Please update abt crudeoil.

    as per ur last update its comes return from $92.50, and now trading at$99. so please suggest wt to do.

    Please….

    Reply
  6. Alexander on February 4, 2012 9:24 am

    Hello Ramki

    This week want to go long on cruide oil. What do you think oil prices reached their lowest level or the pivot point is about of the level 92.80. It can be a flat correction what began on November 17.

    Thank you for your comments
    Alexander

    Reply
    • Ramki on February 7, 2012 5:53 am

      Hi Alexander, although there is mild support at 94.85 levels, I am not happy to trade the crude from the long side for the time being

      Reply

Leave A Reply Cancel Reply

Recent Posts
  • Has Meta (Facebook) stock seen the bottom
  • What Is The Nearest Technical Support For Meta (NASDAQ: FB)
  • Using Elliott Waves to Capture a Trade in S&P500
  • Hedge Funds and Elliott Waves – Netflix $NFLX
  • When Elliott Waves applauds the promoter’s signals!

WaveTimes is a Research Organization dedicated to providing original analysis, reports, reviews, and insights on developments in mutual funds, stocks, investing, foreign exchange, commodities, and bonds.

Contact WaveTimes

L-601 Mantri Espana,

Kariyammana Agrahara, Bellandur, Bangalore 560103

Follow Us

  • Facebook
  • YouTube
  • Twitter

© 2023 Wave Times. All Rights Reserved.
  • About
  • Books
  • Privacy Policy
  • Policies and Standards

Type above and press Enter to search. Press Esc to cancel.