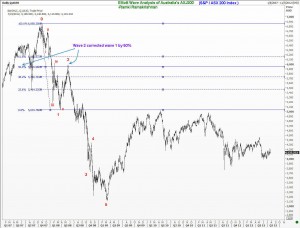
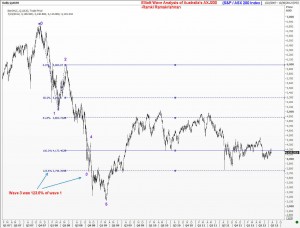
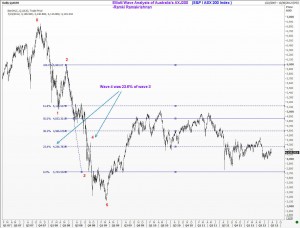
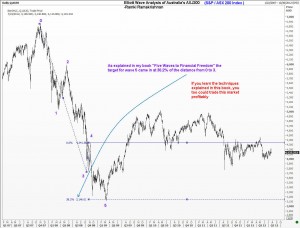
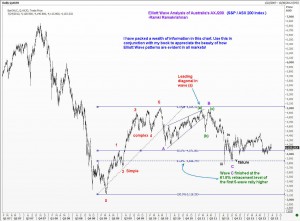
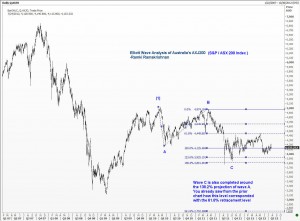
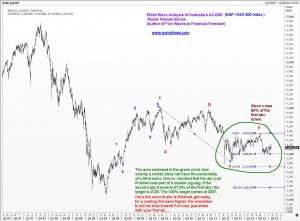
Elliott Wave analysis could really give you an enviable edge in the market. Take the case of Australia’s S&P / ASX 200 index. The collapse from 6858 to the lows unfolded almost in a text-book like fashion. (You could say like the way the Elliott Wave book “Five Waves to Financial Freedom” explains the theory!)
I will spare you the tedium of having to read this text and invite you straight away to study each of the attached charts carefully. Elliott Wave worked like magic every time. Fibonacci relationships are seen everywhere. And it is possible to tell in advance where it becomes an attractive level to enter the Australian stock market for a sizeable move. Enjoy. And share with others.
(Tip: right click on each Elliott Wave chart and open it in a new tab. Then you can skip from one image to the other easily)

