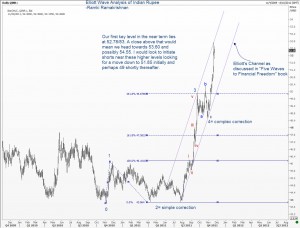
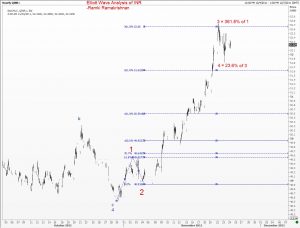
Elliott Wave Analysis of the Indian Rupee should be of interest to you even if you have no interest in this currency! EVery post in Wave Times seeks to give you an insight on how to use Elliott Wave analysis to your benefit. The ideas that I share with you can be applied across all asset classes and you should focus more on the chart than what the chart represents. Often times I have analysed charts of stocks without the faintest idea of what activity goes on in the company whoes stock chart I was studying.
The Indian Rupee has caught a lot of corporations on the wrong foot. They know what mistakes they have done this time (which, unfortunately, will be almost the same mistakes that others had done in the past). So I will not explain that here.
Elliott Wave analysis tells us that the Rupee has some resistance around 52.78/83. If we close above that, there is a good chance to reach 53.60 or even 54.55. BUt such a move will be a great opportunity to put on structures that will alleviate some of the pain that these corporations have undergone. The reason is such a move will represent the end of an extended fifth wave, and as I have illustatred in detail both in my book as well as in this blog, when we see the end of an extended fifth wave, we should be ready for a profitable trade! A swift correction back to near wave 2 of the extended fifth should follow.
If you are one of those who advise your clients having exposure to the Indian Rupee, then do him a favor and pass this to him. You can’t lose because you can blame me if it goes wrong, and claim some credit if it works out!
46 Comments
And Then I guess it would also match the wave structures in Euro and DXY
Hi Ramki – I was hoping that you’d put up an analysis on rupee soon. Your labels for the complex 4th validate what I was working with. Maybe you’d want to give the guys over at Reuters a shout about the rupee low…Aug’11 was lower than the one in Nov. 2010.
hi ramki”””The Indian Rupee has caught a lot of corporations on the wrong foot. They know what mistakes they have done this time (which, unfortunately, will be almost the same mistakes that others had done in the past). So I will not explain that here.””””
so where will you explain? And What are FC?
Manu,
I am keeping my comments focused on EWP.
FC is a short form for foreign currencies
Guess there should be 2 possibilities happening than. One huge FII investment into both bond & stock markets, probably more into bonds. Secondly, major currency intervention by RBI. Sadly though the export oriented stocks will end up getting hammered then.
Dear Ramki By saying “when we see the end of an extended fifth wave, we should be ready for a profitable trade! A swift correction back to near wave 2 of the extended fifth should follow.” does your analysis says we will be again seeing rupee into the teritary of 46 or lower, once 5th extention is over…?!
Piyush, that depends on where your fifth wave has started.
Sir, thanks for putting this up, its exactly my count. I had a question. The USD-INR pair trades on the NSE as well. If you pick up the charts from the NSE website, the highs and lows are different. In fact, it hasn’t fallen below 44 at all if you go by those charts! And the low of wave 2, is at 44.0975 versus the beginning of wave 1, which lies at 44.08! Now, this has somehow kept the count in line with the one we’re following and even you have indicated here, however, it could have just as easily been sub 44.08 as in the count you have presented here.
How do we resolve such a dilemma, if and when it arises?
Thank you! 🙂
Akshay, your analysis is as good as your data. If your data is wrong, you will get a different count. My question is simple. Are you trying to make money or are you trying to become an analyst. If the former, it doesn’t matter because you will discover at some point which is wrong and will take steps to fix your position.
Point taken. My doubt basically was, should we look at multiple exchanges’ charts while making our decisions? Akin to looking at arithmetic and logarithmic charts to construct the right channels. And, yup, you might like to know that I am 21 and I do want to become an analyst! And your blog is REALLY helping me out with EW.
Thanks so much.
Akshay, I would not mix up charts from different exchanges. Best of luck in your career!
sir please do post Nifty wave report thanks
resistance around 52.78/83 was taken out and looks we heading for extended 5th..
on ew can u explain how extended 5th works and what looks on inr as per ew..
Manu, the high so far is 52.72 seen on 22 Nov. There is no change in my views. For detailed information on how extended fifth waves behave there are several posts in this blog, and ofcourse it is covered in detail in my book.
Dear Ramki,
Do you have INR=$ chart for longer time frame say since independence in weekly or monthly view, will get better idea on long term cycle.
What I am seeing in current chart it may be a 1st wave of 3rd or 5th wave of super or major cycle. If that reading is true and correct we are just at the tip of an Iceburg.
This also denotes that even if Gold in $ terms go down to 1300 or below level in time to come we will be hardly having any benefit & may be paying more then what we are paying today.
Same thing for the Crude Price.
Regards,
Piyush
Piyush, please read my response to Dipesh Shah about the value of going back so long. Of course, there are Elliott Wave Purists who talk in terms of super cycle etc. It is just that I don’t travel that road.
Hello Ramki
I have to concede you have taken the mysticism out of the EW Tech Analysis and made it more grasp-able for the common man / retail investor, please accept my gratitude. Adopting the principles cited in your book, as on 14th December 2011, my reading shows that the USD INR, should be seeing price levels of 58 by the last week of JAN 2012 OR first week of FEB 2012. This is not congruent with your detailed outlook of 23rd NOV 2011. It would be very helpful, if you shed some light on this and give a more current perspective on the travel path and possible retracement levels for the INDIAN RUPEE, very similar to the above referred detailed study.
It would be very helpful, if you could lay out the time frame, in which you expect the Rupee to hit the stated higher value levels of 53.60 and then moving on to 54.55 (for going short).
As on 14th DEC 2011, the Rupee has touched the 54.05 level, in light of this, does your view on the price levels stated in your 23rd NOV 2011 hold .
Thank you in advance for your response.
Best Regards
KCK
Thank you once again for your response.
Best Regards
KCK
Hello KCK, There is currently no change in my views on the INR. Unfortunately, I cannot speak of a time frame for a reversal. Clearly it is not looking like it will happen i a hurry, but you never know. For the exporter, these are great levels.
Hello Ramki
Your reading of the USD INR chart has proved to be perfect, in the sense that the extended fifth wave did touch 54.58 on 15th DEC 2011 and then has started to reverse – as predicted.
Morning , 16th DEC 2011, the USD INR had retraced to 52.28 level and there has been a sharp rebound to 52.8150 (close price of 15th DEC 2011). Now the question is that, is this the start of the next five wave pattern – to be counted as wave 0 ? OR is this a subwave to reach the previously predicted level of 51.85.
Thank you once again for your guidance.
Best Regards
KCK
Hi KCK, the actual high was 54.305 I believe…but it finished in the window that was anticipated. The top is very likely in place, and we have seen the first leg of the retracement. Be guided by what I ave described in my book “five waves to financial freedom” dealing with fifth wave extensions.
Yet another brilliant call Ram – today’s high at 54.30 in all probability should qualify for a short/medium term top (well, it aint so simple) and i should be one of those few priviliged ones to be discussing with you and benefitting in real-time. Hats Off. Charting rupee is one of the most difficult tasks imho. And you are a past-master. God Bless You. Wish you a very happy new year. Guru
RKG, Thanks. A move is never over until it is over. And as we can only trade our theory, I will still maintain my original call. But short term traders will have a tough time in picking tops given the current overwhelming fundamentals stacked against the INR. For others, who have a longer time frame, this weakness presents a rare opportunity.
Lovely analysis ramki ji, absolutely spot on…i have just started my journey with elliott waves, seeing how beautifully it works, is even a stronger motivator.
Rgds,
Waquar.
First of all, thank you Ramki, great blog you have here. I’m an amateur Elliott trader in the US. My neighbor is an elderly Indian woman who has most of her savings in INR. Needless to say she is very worried, and she approached me for advice when USDINR was 52.60. I suggested she wait for the high over 54 and then for the correction. However, I am having trouble trying to figure a bottom target which would be a good signal to transfer her INR back to USD.
A retrace to the previous 4th at one degree larger scale would be 48.6 – 50.25 and the major finonacci retracements would be 48-50 zone as well.
If anyone has some opinions or analysis on USDINR, especially on timing a move to USD from INR, I would appreciate hearing it. I know this isn’t a financial advice blog 🙂 The Elliott waves in USDINR seem particularly clear right now, but impulses are easier to count than corrections and sometimes collaboration is helpful in figuring what form the correction is taking.
Good luck to all!
Hi Shabs,
Thank you for your comments. Th best place to discuss this will be the forum. My views are unchanged. A five wave move is probably over. Allow for several weeks of back and forth movement. Eventually the rupee will strengthen again. If your friend is not in a hurry, she should stop watching the market, and you can call her when it dips below 50 again!
Ramki,
My story is opposite.
I was following the USDINR move with the intention to find the right time to convert from USD to INR (for personal use). Unfortunately I missed the ‘top’ as I was not expecting the move down to be so quick. The swiftness is so amazing.
I still can not comprehend how the impact of RBI restrictions placed so suddenly (on 15 the Dec afternoon / evening), kind of got predicted by technical tool!!!
Everybody else in the market seems to have got caught by surprise but looks like you are not surprised at all. That is terrific!
I apologize for asking this, but do you have any advice for some one like me who just wants to convert USD to INR ? Is it ‘Quicker the better’ or is there a certain upmove before the next down move?
Thanks
Satya
Hi Satya, The person who can be patient, and who can be brave at the right times will become enormously rich if he can use Elliott Wave analysis. That about sums it up.
Dear Sir,
Congratulation on getting so accurate in so much advance on USD/INR.
The spot price topped at 54.295 on 16th Dec, hovered below 53.3 for a few weeks and today it broke trendline (as well as lower side of the channel) and traded around 51.700.
What is interesting is that a lot of active traders are still bullish than bearish and analysts’ calls are for higher targets.
Dear Ramkiji,
If you can update your view on USD=INR, as today it has come down very fast and currently quoting around 51.65 or so. Does current pattern suggest we have complited 3rd wave at 54.25 & then started 4th corrective with 1st & 2nd wave with in A wave is comlited & 3rd has started at last week’s Top..??!! Or I am misjudging the counts comlitely..!!?? Also if you can update your views on Dollar Index which is currently hovering around 81 level to the defind Currency Baskets.
Regrds,
Piyush Shah
Hello Ramki
Please accept my congrats for your fine reading and precise estimation of the USD INR (till the price level of USD 51.85 and it has started trending more towards the 51.50 levels. I re-checked and re-drew my wave calculations as guided by your book and turned around my earlier disagreement with your calculation (refer my first-second message to you).
Now in context to your estimate of a possible down move to 49 levels, is once again being contradicted by my wave calculations on the fibonacci levels., in fact my calculation places the USD INR to re-touch the price level of USD 54.55 and goes on further above to the 56 levels. My calculations are exactly as guided by your book, so I am terribly confused and request urgent help.
The objective of this query is seeking your guidance as to where could I have gone wrong and how to rectify the same. Please respond at the earliest.
If for any reason, tutoring on this predicament will not be possible in this forum, then I implore you to re-visit the EW Tech. Analysis of the Indian Rupee (INR) once again this forum.
Best Regards
K.C.Kamakoty
Hello K.C. Kamakoty,
I suggest to draw a channel on USD/INR chart.
Clearly, the day when USD touched 54.295, there was ‘THROW OVER’.
And price comes faling under gravity after this THROW OVER.
Regards
Dinesh
Hello Ramki, Thanks for all valuable information. I wonder which charting tool/software you use for charting elliott wave automatically like fibo lines. Would you mind to share the name of it. Thanks in advance S.Billa.
Hello Billa, thanks for your question. I use Reuters Eikon, but most charting applications should have fibonacci lines incorporated in them. EVen if they dont, you could use a speadsheet to compute the levels. Drawing them on the chart is visually pleasing, but you could make money without the asthetics! Good luck.
No follow up charts to such an interesting chart?
Sir,
Congrats…..
Your Tgt For INR Rs.49 achived.
Great view.
Jay Ho.
Hi Ramki,
Hope all is well.
From what I have understood ( with a lot of help from your detailed explanations), over the past few years, is that
A) We have had a five wave upmove on INR, after a long 2 year 4 months correction of 61.*% of the previous move. now the current move was much swifter that the previous move, though smaller. I am assuming the August low of 43.80 as Wave 0.
No we have had a five wave rally, a correction back to the fourth wave as brilliantly predicted by you. The correction is also about 50%, with extreme oversold conditions ( characteristics of a wave 2??). I have Wave A from 54.28 to 52.20 , Wave B retracing 61.8% of A @ 53.48. Wave C seems to have completed 200% of A @ 49.32. Also we have a positive divergence on the RSI, which prices have still to confirm. But assuming everything, if we have a 5 wave upmove, shouldnt the next logical move be another 5 waves up, after a correction ( which is underway). On a slightly longer term, I have counted some move over in 2000-2002, with a long correction of 6-7 years till 2008. Then an impluse move of 13Rs in 12 months. again followed by some wave 2 correction of 61.8%. And then the start of the current move from August 2011 as a Minor wave 1 of some Wave 3 up.
Would appreciate if you could let me know if the above sounds correct,
Thanks
Hello Vivek, Thanks for your post. I would recommend that you tie in the fundamentals with your analysis at this time. This will point to the INR getting stronger, not weaker.
Ramki,
Just now INR hit a low of 48.68.
That’s quite a rise for Rupee.
Could you spare some time and give us your valuble EW update on USDINR, for the benefit of not very technical mortals like me.
Thank you,
Satya
Hi Ramki,
Thanks for your reply. I actually did try to use fundamentals along with my analysis. And except for the current liquidity coming in, everything else seemed stacked against the INR. I mean high Fiscal Deficit, lower interest rates going forward, consistent high inflation eroding the PPP of INR, the USD reserves of RBI against the External Liabilities. Didnt come up with a rosy picture, except for liquidity which is the joker in the pack……
Coming back to pure technicals, how would you read the move from 2008 April lows of 39 odd to now….
I understand your time constraints and thank you for your reply again..
Vivek, One possible interpretation is the May 2002 high was end of a majo impulse wave, and we poasted an irregular B wave in Dec 2011. However, I would often view time spent on such long-term calls as futile because it serves no real purpose to most people. Even if I am right, no one is going to remember this comment next week, much less next year…
Hi Ramki,
Yes I agree that such long term is only of academic interest , and has no trading value.
As always, thanks for the amazing work, and the knowledge you share with all of us.
Ramki, i have been reading your book “5 waves…” based on that and looking at current price pattern I was thinking if the 54 to 55 range called in this post as wave 5 is whether a wave 3? and the decline from 54 zone to 48 zone was wave 4 and the impulse from there to current levels is wave 5??
is it the above or we are in an extended wave B, i am not sure of this extended wave B as no such extreme extension are covered in your book.
looking forward to your inputs to learn this better, thanks,
SP, Extensions occur in impulse waves. There is no such thing as an extended B wave.
Hi Ramki,
Thanks for the quick reply. It may sound absurb, but even though I was aware of Elliot wave as a technique, was never so much interested in reading a book on it. Till I hit your blog during a casual search. And your book is the first I am reading on EW 🙂
Thanks for confirming that there is no such thing as extended wave B. Does it mean that we got a case of extended wave 3 to the 54-55 zone and wave 4 down from there and currently in a wave 5?
Going by that assumption, and also referring to the book 2 of the 3 impulses would be equal and one would be an extension typically. The wave 5 seems to have again extended beyond the rise of wave 1. I am having a bit of hard time understanding this current pattern by just reading the book.
appreciate your valuable response.
Thanks,
Hi SP, I suggest that you visit as many old posts as possible after reading the book and also read some of my responses to questions. Soon you will become comfortable with Ewp. Good luck
So No follow up analysis on this? Rupee has substantially depriciated from your last analysis. Is it going south further?