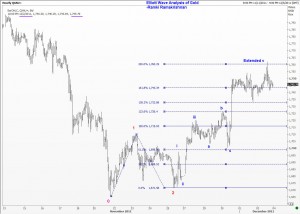
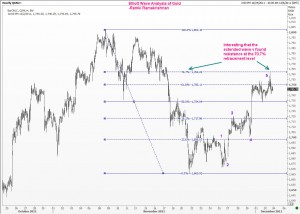
In my 29 November Elliott Wave commentary on Gold, I suggested that Gold would probably need to come down a bit before rallying. The reason was I was looking for a much sharper recovery than what I was seeing. However, the markets just fooled me. Sure it did come off to 1700, but it didnt quite get to 1662 again 🙁 What happened there?
Well, as you can make out from the first Elliott Wave chart of Gold that you see here, we got an irregular 4th wave, which is a complex correction, and that pause sort of took me off the track. Still, all is not lost. We do have the making of an extended 5th wave, and usually that is a warning of a sharp correction. But beware of paying too much attention to the very short term charts! I have often warned you in this blog, (and if I remember correctly, also in my book “Five Wave to Financial Fortune”) that you can make decent money by trading the bigger waves. So what is my take in the bigger picture?
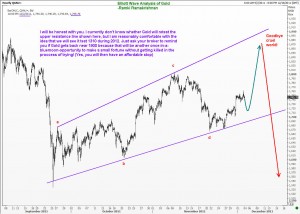
Elliott Wave analysis of the loger term Gold charts tells me that there is a reasonable chance for us to go dramatically lower, say to around 1310 during 2012. You should therefore start making plans to identify a good, low-risk selling level to capture that huge move (if and) when it happens. Of course, I hope to be around to give you my two cents worth at that time, but today’s Elliott Wave comments on Gold’s outlook is laying the foundation for that move. Just remember that you read it here first, and when others pick up the ideas and publish it, you know that they are also secret members of the Wave Times club!
Enjoy.
17 Comments
Dear Mr. Ramki,
As you have mentined correctly don’t pay attention on shorter period charts, make decent money by trading bigger waves. In reference to this I humbly request you to post super cycle counts if not possible in daily then by using weekly or monthly charts representing more broder picture & counts on that. I believe if that counts are correct & if one have proper money management skill then it is very easy to make more money with lesser risk.
Regards,
Piyush
Hello Piyush, i think daily carts are best for trading. What I meant about ST is we tend to make more errors there.
Hi Ramki
The e wave on the Euro would correspond to the downward move now of the gold price, but the movement up to $1900 would correspond to a wave two up on the Euro and the crash to $1300 would correspond to wave 3 down on the Euro. That’s my understanding but I see your wave count of the Euro down is labelled abc but I considered that a wave 1 down of the Euro bottoming at 1.31. So even though I might have the wrong wave count I can still make money as long as I know the general direction (long term). Am not sure what yr count is on the Euro/$. As long as one knows what and impulse and a correction wave looks like you pretty safe, hey? Thanks and regards.
Ramki,
From July 1999 bottom (@250), wave 1 of impulse wave III started and could have ended in March 2008 @ 1030, and wave 3 would have ended @ 1920 (1.618 of wave 1) in September 2011.
The sub-waves within wave 3 have wave (1 – 1005) and (3 – 1225) being equal and wave (5 – 1920) is of 1.618 of (1 thru 3).
So, that leads me to believe that the current wave structure is the fourth wave (of III). However, I think this will most likely be a deep correction (since wave 2 is only 38.2% of wave 1).
Since wave 2 (ending @ 680) was a double zigzag, I expect the fourth wave to be either a flat or, simple zigzag. It could most likely be a flat, but it will start with a zigzag and then move up I believe.
Primary:
If the first leg of the zigzag has already finished (assuming the analysis is correct), the probability of Gold breaking below 1400 is very high. If the c wave of flat fourth wave may have just started, it could go very well reach 1200 in 2012 before moving up and down to form the flat (like a sideways cone).
Alternate:
If the flat fourth wave starts without the zigzag, then Gold would reach 1900 easily before moving down and up and down to form the flat for the next two years.
Final thoughts:
This analysis would fail very badly if Gold moves beyond 1865. And I might have to take up Golf as my other source of income.
Cheers
Naga
Hello Naga, What you are saying is perfectly possible, and indeed, my latest post has taken that into consideration. That approach will have the 4th wave already finished at 1535, and the current recovery is actually an expanding diagonal triangle as portayed in the chart on Wave Times. So whether it is still part of the 4th wave, or it is an expanding diagonal triangle in the fifth wave, the conclusion is any recovery towards the prior high should be used to turn short in Gold. I have often mentioned in this blog as well as in my book that our wave counts should serve us. We use them till they are useful, and then discard them in favor of a new count when we have to. This approach is what makes WaveTimes special….
Dear Nagarajan,
Thanks for your major wave count analysis. It would have help people like us who are still in learning stage with the help of the chart.
I request Mr. Ramki to post such long term count chart to get better & Broader Idea. As it is rightly said.. “Picture speaks Thousand Words”
Regards,
Piyush
Hi Piyush, The Elliott Wave Forum exists precisely for this purpose, for members to exchange ideas. As for my own posts, all you have to do is to look under the category Gold, and you can go back one by one to see how my medium-term views on Gold has evolved. Unfortunately given my full-time job, I am not able to post as often as I would like to, on all time frames and all instruments (stocks, indices, commodities, currencies etc).
Nagarajan and Ramki..
Awesome analysis. Really appreciate the exchange. Thanks.
Dear Ramki
Now tell us , wt can we do , go to long at this stage for tgt of $1850 . or short below $1700.
Please update so we dont go to die.
Hi Prithvi, Just a gentle reminder. Wavetimes does not offer trading or investment advice. I share my ideas mainly with a view to guide those who wish to learn my techniques. Remember also that I have no commercial interest in this. Even the book is priced so low for this reason. I suggest you use the forum to discuss trading ideas with other members. Good luck.
Ramki,
You have been so right on Gold and crude. Do you have any update on Silver and S&P 500? Thanks.
What a nice call on Gold…………This is brilliant Ramki
I think every member agrees with me
GOOD LUCK ALL.
hi sir,
what next resistance as 1535 took big support
What software can an independet investor use to analyse the charts? I have been trying to find one with no success! BTW, love your blong.. I am taking baby steps.. and hopefully will be able to gain from you and other contributor’s perspective!
I will apprecaite if you or anyone else can suggest a good chating tool/website/platform for trading as well as chart analysis purpose.
Thanks,
Hi Bimal, I believe Reuters has a cheaper alternative for non professionals. Do check out with your local agent. However, for ELliott Wave Analysis, there is no need for any special software. Just a bar chat and a simple excel spreadsheet or calculator is enough! Good luck with your efforts to learn EWP. We all started with baby steps.
Dear Ramki,
Would love to see an EW update from you on gold, now that is broke 1530 level intraday, which turned out just to be a whipsaw, and whether acc. to EW, we could be heading lower now.
Thanx
Vaibhav
Could you revisit Gold please, is it possible that Gold finished ABC retracement at 1523?