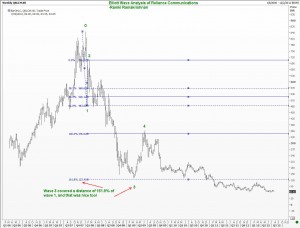
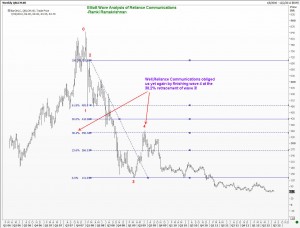
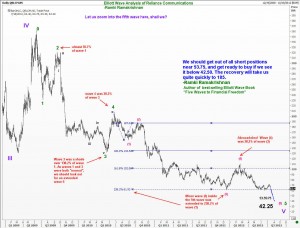
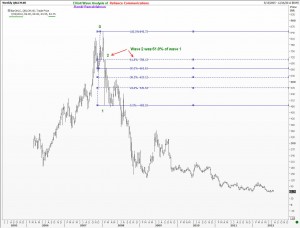
If you look carefully, you can find some real gems in the market, and these are the stocks that you should trade! Reliance Communications Ltd is one such stock, as it has behaved perfectly from an Elliott Wave perspective. In today’s update, I will present you with several charts that shows how one could have traded this stock from the short side all the way down from 845 to current level of 64 (Yes, such trades are indeed possible using Elliott Wave Analysis to pick low-risk entry levels, and if you are a smart trader, you could have traded the corrections inside too). My methods are explained in the best selling ELliott Wave book “Five Waves to Financial Freedom”. You can apply those techniques to any well traded instrument. But today, our Elliott Wave Analysis will focus on Reliance Communications Ltd. This is an Indian stock, but you should study the charts even if you have no interest in India! They make quite an interesting read. Enjoy.
P.S. Can someone please alert me if/when this stock reaches near 44 so I can place my orders! Thank you.
- About
- Elliott Waves
- Equities
- Commodities
- Forex
- Raves
- Consulting
- Ramki’s Watchlist
Elliott Wave Commentary on "Reliance Communications Ltd"
Previous ArticleElliott Wave update on Nestle India
Next Article Elliott Waves signal Home Depot correction
57 Comments
Ramki Sir,
Thanks very much for ur valuable effort in order to give an edge to all who follows EWP. I just want to know that when r we going to have ur next book ? and ur fresh view on S&P500, r u still bearish or scene changed??? pls reply…
Hi Ankur, You are welcome. No change to what I wrote last on S&P500
Hi Ramki,
I have already put an alert,will inform u as soon as it touches 44.me too will buy,,any stoploss.? If so how?I had first read robert prechters elliot book,and am in the process of reading your book FWTFF,Its a fantastic book,very simple n very easy to understand and free flowing(unlike robert prectors book which is like a matter of fact information) (my wife who is also doing well in futures without elliot analysis , intends to read your book.).I have now developed a habbit of opening your book and refering to it when i am doing my counts on charts.cant wait for your second book!!when will it be out??both in soft and hard copies.Also yours is the best book on elliot wave theory.no doubt about it.
P.s: what is you opinion on neo waves (glen neely).?
and could you give a wave count of DIVIS LAB india.?I know you must be very busy,and I would understand even if you couldn’t.
thanks and good work!
jude texeira
Hello Jude, Thank you. I will be entering Rel com as an investor with a time frame of at least 1 year to avoid cap gains tax etc. Also, I will buy more if it drops by 50% from 44! Remember, WaveTimes is not offering trading recommendation as such. If someone uses it to trade, he/she needs to know money management as well. Re Glen Neely, I don’t have an opinion on others’ work. He is well respected in many circles.
thanks ramki
very nice work
but why target of recovery is 185 .how you calculate it
Ahmed, Thanks. Have you read my book? If yes, look at the chapter relating to fifth wave extensions.
as indicated on graph,for the minor wave(3) inside the 5th wave which as per your suggestion is 238.2% of wave(1) may not be correct.
Since the time ratio between 1 and 3 is more than 3.
Hi Gul, It is entirely possible that everything I have written is wrong. Elliott Wave analysis is like that. We have to trade our hypothesis. Else it becomes a futile exercise.
u r a very polite person 🙂
Dear ramki,,,,thanks for rel commm update —-though i am a trader by profession living on just trading for last 12 yrs and quite new to elliot wave,,, gone through u r book and frankly could not have marked the waves at present had u not posted it ,,, just for the learning purpose —-some of the stocks which could be immense interest to mark wave counts would be ( KFA, GMR, GVK),,,,,but frankly i am unable to mark them at present
also it would not be wise to compel u to mark the wave counts on them .
also for nifty which behaved entirely in different fashion this time ( as per as EW) is considered ,,,, without recating more than 50% ,,,, will the down move behave like that only
with due regards
Hi Digvijay, labeling the waves with confidence comes with practice and experience. Don’t give up! Whatever methods you have been following with success all these years, don’t give them up also. Supplement them with EWP. Good luck.
Dear Ramki ,thanks for the excellent analysis, all retracements and projections perfectly in place. I would be eager to remind you when R.COM. reaches 44.
Sincere request to update your latest view on Nifty. I am quite aware of your time limit but still cannot resist myself. Also I know that there are no trading ideas in EW but would like to tell you that I am short on Nifty and TCS now.
Thanks and regards.
P.S. Was missing your post for many days.
Hi Ramkiji,
After long time two Indian Stocks with extreme opposite direction…!!! Great Going.
If time permits look at Reliance Capital, is it going same way to Rcom..!!??
If yes, please elaborate little on current count & approx. target.
could you provide an elliott wave analysis on Niko resources (OIL)
I think the downside has been severe -even by worse than the 2008 financial crisis.
What may be the final downside price?
Thank you so much.
Ron
Hi Ron, thank you for posting. I must aplogize because I get too many such requests and a proper analysis of any instrument takes a lot of time. Hope you understand.Regards
Respected Sir,
I get a lot to learn about EW from your charts irrespective of any exchange,your experience and hard work is clearly reflected.Even i practice EW and wanted to discuss my work on a particular stock.It would be very kind of you to accept this request.
Hi Chirag, Thanks for writing, but I am sorry that it will be impossible to discuss individual stocks due to my other commitments
Sir
Thanks for your great book. After reading your book, i started applying elliot wave on weekly chart since 2002 ( Log Scale) of Viceroy Hotel. It seems to me that this stock commenced its journey from Rs 14.65 (wave 3 of 3) to target of Rs 103.3 (138.2%) or Rs 144.6 (161.8%) . It formed three white soliders on weekly charts. After analyzing once again , it seems we are in last leg 5th wave of C , breaking it Low Rs 14.65.
How to avoid this confusion where rally started or downmove still there?
Hi Prakash, Thank you for writing. You need to remember that the markets are dynamic.What appears as a third wave today may cause you to reevalaute as a C wave in future if conditions change. Be flexible, take profits, keep stops. Thats how you play the market. EWP gives you an edge that others dont have. (Sorry I get too many requests to look at individual stokcs)
Thanks for your comment, as i am new EW. as per your book the correction should be in ABC three parts. as per the above counts you have counted 5 wave, should i assume its completed the A part of correction only.
Hi Jaspal, Thank you for your question. My approach to the markets is not so much in getting the counts right, but the direction and a low-risk entry level right. As you are new to the WaveTimes club, you will soon discover how this approach is not only the desirable one, but also an approach that is in keeping with the spirit of Ralph Nelson’s approach. Good luck.
Ramki Sir,
How did you deduce the possible TGT 42.25 ?
This is how I have made calculations.
Minor wave (5) in Pink colour.
0-3 expansion gives following TGTs
38.2% – 53.80
50% – 36.50
61.8% – 19.15
Intermediate 5 in green colour.
0-3 expansion gives following TGTs
61.8% – 65
70.7% – 45.40
Wave 5 green to be an extended wave it has to be larger than 61.8% hence possible TGTs could be 45.4 or 36.5 and you have rightly given an alert at 53.75 (38.2% a key level when w(3) pink is quite an extended one)
Sir, did I miss some thing ?
@RainMaker, IMHO:
@Ramki & @All, I did some analysis reading FWTFF, so pls correct me, as my approximations are a bit off your fibonnaci targets
“How did you deduce the possible TGT 42.25 ?”
If you take Minor Minor 5th wave starting at 109.7, then …
0=109.7
1=86.8
2=101.8(Approx 61.8% of 1)
3=61.2(Approx 161.8% of 0-1)
4=72(Approx 23.6% of 3)
5=53.47(Approx 38.2% of 0-3)
OR
5=42.027(Approx 61.8% of 0-3)
OR
5=23.5(Approx 100% of 0-3)(Extended as 1 & 3 seem to be normal)(That’s why maybe Ramki has explained in an earlier Reply “Also, I will buy more if it drops by 50% from 44!”)
Thnx buddy !
Great analysis ! I think it explains everything.
(NB: When w3 is 1.618 time of w1 it is an extended wave. Offcourse, we can have two extended waves)
I did saw the sub minor 5 but did not do the maths, my bad.
Now the question arises, which 5th wave ending will prevail ? any clues ?
Keeping in mind that Ramki has given a fast retracement TGT of 185 and there are 4 different sets of 5 wave endings.
Incidently, Rcom reached 53.50 today.
Sir, is it possible to make a matrix of these Fibonacci ratio of each wave count starting from 0. What is the % of wave 1 as said Tony above. Thereafter ratio comes into operation.
counting wave 1 is difficult to decide from 0 ,after that ratio can be applied.
Time is another factor, if you please give us guidelines.
Also please suggest some simple software to calculate such multiple ratio.
Thanks–jkpahuja
in the final 5th wave,wave equality of 1=5,gives target of 49.30 for RCOM
i have nothing to write except blinking on seeing your mastering the waves
Mani P
HI Mani, Thank you. You too can gain expertise. Just keep practising!
Sir,
sir please if you have spare a time please look at HINDUNILVR (INDAN STOCK) OUT PERFORM the market and i think This stock in wave 5 is extension and near is target 508 ( same AMBUJACEM ENDIG DIOGNAL / ITC , BATA INDIA) Please give me answer my thinking is right.
Thanks
Posted here is a chart for Hindustan Uniliver
Rainmaker, while I am pleased you are going in the right direction, rememeber to start counting from a SIGNIFICANT low. As you are looking at a weekly chart, the March 2007 low is one possible starting point , but even better is teh Aug 2004 low
Sir,
regarding these stocks (HIDLV /AMBUJA/ ITC BATA)
I want to know whether my observation is right or wrong, whatever i have learned from your website and your book, am i applying it correctly ?
Hello Hemin, Thank you for writing. Unfortunately, I am not in a position to look at stocks that freinds like you are requesting me on a daily basis. Of course, when you post ideas like what you have done, a lot of other readers would take notice and check it out. SOme might even post their opinioons here. Good luck.
Dear Ramki,
Thanks for the detailed analysis of RCOMM. As you mentioned fifth wave is extended and hence we should expect a recovery upto 184 which is (2) of 5 of V.
However, looking at big picture, ever wave V is extended. Hence in long run can we expect retracement upto 359 level or above.
Hi Pravin, yes that is indeed possible, but I’d like to take this one step at a time.
Hi Ramki,
Do you think RCOM is bottoming out around 53 levels or still possibility of going down to 40 levels. can see divergence on RSI. Please comment.
Hi Sir,
I am very new as far as Wave analysis is concern .Today (29th Aug.12)Rcom has closed at 48 ,and i just want to share my view ,As per Flag pattern (Top of 11th July to low of 27th July Difference) .target is 40-37 INR
Thanks for your valuable information on Wave analysis,from last 2 month i am reading your blogs for different markets and trying to learn.
Thanks and Regards,
Vaibhav Kawade
Hi Ramki,
I have been following your posts since the AAPL Bottmed at $530 and bounced to its current high. After your RCOM@ 64 analysis just waiting to hit 44 (right now it is at 48.20) thanks for the EW analysis. I bought your book and have been trying to assimilate EW.
Thank you
My Dear Ramki Sir
just to remind you as i have decided– RCOM has come to 48.2 today. four more counts for one of your tentative target for entering a long trade. i shall keep you posted Dear Sir.
regards
rcom is on an uptrend you may not see 44 again.it completed a 5 wave decline in c.so bye bye
Hi Rajesh, Thank you for your note. I must say that it does look like we wont see 44 in a hurry! But what are we going to do next? That is probably the more important question we should ask ourselves.
lots of opportunities in the market,ramkiji.we wait patiently for another 5th wave extension elsewhere…hul is one.usdinr is getting oversold..time soon to buy.
like they say “the vulture is a patient bird” .
request you sir,if there is any 5th wave extension to be traded that you spot,please do post it.as you said”5th wave extensions can make you rich”
a savvy trader would have bought rcom anywhere near 44-48.downside was few ticks upside was tremendous
Sir,
How do we differentiate between bear market corrective patterns & bull market impulsive patterns
Hi Moti, I suggest you get hold of a good book on Elliott Wave Analysis and then come back to WaveTimies to look at all the examples.
Thank you sir !
Want a hard copy delivered to my address; but as I understand it’s available only in digital format from the publisher;please let me know if I can get it in hard copy version.
Thanks,
Sincerely,
Kok MS
Hello Sir , I was stuck with some thing pls help out . As Mr AmateurTony says counting of 5 th wave , i stuck and little got confused about the fall down from 72 on dated 11th july to low of 46.55 on 30th Aug , it look like 3 wave pattern , so it might be correction and 5th wave of 5th still to come . I may be wrong , pls help me from this confusion . Awaiting your reply sir.
HI Avinash, Peraps you should read my book carefully again, and come back to the comments on RCOM. Then things will be clearer.
ramkiji
sir please look at rcom to see if extended 5th is done
Rajesh, you should read my responses to prior comments.
Hi Ramki,
Good Day!, have been practising EW for couple of months now, not just in financial instruments but then I’m also using it for studying customer satisfaction psychology, IT ticket volume patterns, horse racing and I see EW in there as well. After all, it is crowd psychology and every day when I see charts it makes me clear and then I go wrong sometimes and I keep correcting the counts
Recently in my blog had mentioned about Divis Labs reaching 1200 to 1225 levels when it was 1025, and it just did exactly the same way of course few points lesser
I recently read your book on EW, it was wonderful it not only was interesting to read but then is worth reading multiple times to refresh ones concepts thoroughly. Shows your passion for EW and no wonder you are doing it for last 30 years, I want to be as passionate as you are and I spend atleast 6 to 8 hours reading EW across all instruments. Money making is just a by product of the understanding. Trust me earning money doesn’t give me that satisfaction, of course it is required but what gives me more pat on the back is when the counts go right as we studied and studied and studied
Now I’m researching parallely on EW & Ishimoku indicator. The reason why I compare is to make less risky trades with making less loss and reasonable profit
Now coming to RCOM, what a wonderful explanation of the chart, I have almost read this particular blog more than 5 times. Every time when I see it, it just highlights how much wisdom you carry on price movements by mastering EW
A quick question though, RCOM made a low of 46.6 in Aug (NSE recorded) and reversed from there on.
Even going by Ishimoku, the kumo cloud acted as a resistance so far has turned to support around 55 to 60 levels
I believe the downfall is over and it is time to buy at decent/significant dip. Your thoughts on this please
Regards
Naga
HI Naga, Thanks for your comments. I haven’t studied or used Ishimoku indicator. I guess you are aiming to become a technical analyst. It will probably be more rewarding if you master one technique and apply it to the market.Good luck with your pursuits.
Dear Ramki—read u r book —-watched few trades—-but some how i find u r more into theory and less into real world—–also i find u trying to avoid the real question when it comes to rcom i request u to go again and find the fall from 95—-50 was in any study is it mentioned ???i know u did mentioned its rise up to 185 —–but the fall from 95-50 ?????? or rcom changed its face on news as the sharp rise from 50-100—-was it that we would miss or we failed to learn u r view point….with due regds
Hello Digvijay, Thank you for your comments. After you learn the theory, you should also learn to apply it to the real world. As a first step, we need to be clear about a few things (a) the market never moves in straight lines to the target. So while the 185 target is very much in play, it would be simplistic to assume that it will head there in one go. (b) the decline from 95-50 is part of the process by the market to confirm a proper low is in place. Whenever you see the end of a big decline, don’t be surprised if we attempt a retest of the lows. Good luck in your learning. Please remember that this blog is to teach about Elliott Waves, not to guide you with real world trades. Trading requires a certain discipline and Elliott Waves would contribute to that discipline.
thanks for the reply-=—but the confusion still exists—-but its a nice attempt—-thanks and by
Dear Sir.
It has reached levels of 20 now.
I invested heavily due to major reversal.Now what should I do.
Ginnish,
I can’t believe that you have looked at an analysis done in 2012 and invested in it after 5 years.
That trade made money for us at that time and afterwards it was a big no-no. Besides, this blog doesn’t offer trade advice. It is a resource to learn Elliott Waves. Take care.