• About
  • Elliott Waves
    • Elliott Waves Explained
    • Elliott Wave Magic Illustrated with Wave Charts
    • Elliott Wave Edge – How Elliott Wave Traders Win
    • Fibonacci Number Series and Elliott Waves
    • How to use Fibonacci Ratio Retracements
    • Elliott Wave Books
      • The Elliott Wave Book – Five Waves to Financial Freedom
      • Dividend Growth Investing Using Elliott Waves
    • Videos
  • Equities
    • Indices
      • Africa
        • Egypt
      • Australia
      • European Indices
        • AEX – Index, Amsterdam
        • DAX Index
        • Istanbul
        • Russia
        • Spain’s IBEX 35
      • Asian Indices
        • India
        • China
        • Dubai
        • Kuwait
        • Kuala Lumpur
        • Pakistan
        • Saudi
        • Taiwan
      • US Indices
        • S&P500
        • Nasdaq
        • Dow Jones
        • Dow Jones Utilities
    • Stocks
      • Asian Stocks
        • Indian Stocks Trading
        • Dubai Stocks Outlook
        • Japanese Stocks
        • Kuwait stocks
        • Saudi Stocks Outlook
      • African Stocks
        • Egyptian Stocks
      • Swiss Stocks
      • Australian Stocks
      • European Stocks
      • US Stocks outlook
      • UK Stocks
  • Commodities
    • Copper
    • Gasoline
    • Gold
    • Natural Gas
    • Oil
    • Palm Oil
    • Raw Sugar
    • Rubber
    • Soybean Oil
    • Silver
  • Forex
    • AUD
    • Bitcoin
    • CAD
    • CHF
    • Euro
    • GBP
    • INR
    • NZD
    • JPY
  • Raves
  • Consulting
    • Consulting
  • Ramki’s Watchlist
Top News

Has Meta (Facebook) stock seen the bottom

March 21, 2022

What Is The Nearest Technical Support For Meta (NASDAQ: FB)

February 7, 2022

Using Elliott Waves to Capture a Trade in S&P500

January 27, 2022
Facebook Twitter Instagram
WaveTimes Blog WaveTimes Blog
Wave times
  • About
  • Elliott Waves
    • Elliott Waves Explained
    • Elliott Wave Magic Illustrated with Wave Charts
    • Elliott Wave Edge – How Elliott Wave Traders Win
    • Fibonacci Number Series and Elliott Waves
    • How to use Fibonacci Ratio Retracements
    • Elliott Wave Books
      • The Elliott Wave Book – Five Waves to Financial Freedom
      • Dividend Growth Investing Using Elliott Waves
    • Videos
  • Equities
    • Indices
      • Africa
        • Egypt
      • Australia
      • European Indices
        • AEX – Index, Amsterdam
        • DAX Index
        • Istanbul
        • Russia
        • Spain’s IBEX 35
      • Asian Indices
        • India
        • China
        • Dubai
        • Kuwait
        • Kuala Lumpur
        • Pakistan
        • Saudi
        • Taiwan
      • US Indices
        • S&P500
        • Nasdaq
        • Dow Jones
        • Dow Jones Utilities
    • Stocks
      • Asian Stocks
        • Indian Stocks Trading
        • Dubai Stocks Outlook
        • Japanese Stocks
        • Kuwait stocks
        • Saudi Stocks Outlook
      • African Stocks
        • Egyptian Stocks
      • Swiss Stocks
      • Australian Stocks
      • European Stocks
      • US Stocks outlook
      • UK Stocks
  • Commodities
    • Copper
    • Gasoline
    • Gold
    • Natural Gas
    • Oil
    • Palm Oil
    • Raw Sugar
    • Rubber
    • Soybean Oil
    • Silver
  • Forex
    • AUD
    • Bitcoin
    • CAD
    • CHF
    • Euro
    • GBP
    • INR
    • NZD
    • JPY
  • Raves
  • Consulting
    • Consulting
  • Ramki’s Watchlist
WaveTimes Blog WaveTimes Blog
Home » Elliott Wave Analysis of ZSL UltraShort Silver
Silver

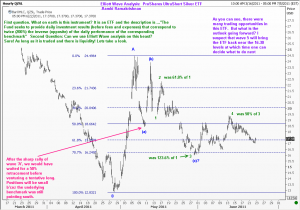
Elliott Wave Analysis of ZSL UltraShort Silver

RamkiBy RamkiJune 23, 20119 Comments1 Min Read
Facebook Twitter LinkedIn Telegram Pinterest Tumblr Reddit WhatsApp Email
Share
Facebook Twitter LinkedIn Pinterest Email

First question. What on earth is this instrument? The ZSL Ultra Short Silver is an ETF described by Reuters as…”The Fund seeks to provide daily investment results (before fees and expenses) that correspond to twice (200%) the inverse (opposite) of the daily performance of the corresponding benchmark”

Second Question: Can we use Elliott Wave analysis on this beast?
Sure! As long as it is traded and there is liquidity! Lets take a look.
For those of you who are not into ETFs, this exercise is still a learning experience. For Fund Managers who are exposed to this ETF, well, here is a neat exposition of how Elliott Wave Analysis works in your sphere just as well as it does elsewhere. Enjoy.

Share. Facebook Twitter Pinterest LinkedIn Tumblr Telegram Email
Previous ArticleGBP/USD outlook- Head and Shoulders Pattern
Next Article GBP/USD update
Ramki
  • Website

Related Posts

Monitoring a position after execution

October 19, 2012

Elliott Wave Analysis of Silver – update

October 17, 2012

Elliott Wave Comments on Silver

October 8, 2012
View 9 Comments

9 Comments

  1. Bob D on June 23, 2011 6:35 am

    Hello Ramki, I am enamored with your analysis of ZSL, and as a student of yours, I’d like to submit this question. ZSL has a recent low price of $12.83 and the high price of $24.99. If $24.99 is thought to be an A wave, then the decline you mention in your post to $16.30 would indicate a B wave, which would give rise to a C wave recovery. I believe Elliott wave suggests C waves are usually as long as A waves – therefore I would expect the C wave to reach $24.99 as a minimum and the potential to rise to $28.46 were wave C would equal wave A. Is my thinking correct?

    Reply
    • Ramki on June 23, 2011 11:25 am

      Bob, you are a fast learner!

      Reply
  2. John Dobrowolski on June 23, 2011 7:45 am

    Thank You so much Mr. Ramki for your detailed and speedy analysis. I’m watching closely.
    All the Best, – John

    Reply
    • Ramki on June 23, 2011 8:22 am

      John, My pleasure, as you pointed me to something new, and I enjoyed looking it up. Best vof luck. Ramki

      Reply
  3. zen on June 23, 2011 8:03 am

    Hi. I enjoy your articles. Since silver’s high of just under $36.75 yesterday, it has fallen through the 20DMA, what many consider a trend changer, and now through the 120DMA in the span of about 24 hours. A bearish case now exits for the metal which may bode well for ZSL. Any ideas on $silver on how far down it will go, if it indeed goes that way? Personally, I will be watching for a reversal at both the 200DMA and 300DMA, probably at $30 and $26 respectively when we reach them.

    Reply
    • Ramki on June 23, 2011 8:28 am

      Hello Zen, Thank you for writing. Elliott Wave Principle suggests that after an extended fifth wave is completed, the first target is the 2nd wave of the 5th itself. Later on, should bearishness persist, we could see the 4th wave (like in most normal cases, where a downmove takes us back to the previous 4th wave). This happens to be at 26.38 for Silver. However, there is a minor support at 31.65. Good luck.

      Reply
      • zen on June 24, 2011 8:24 am

        Hello, Ramki. Thank you for your reply. I have yet to read into the theory, but what is interesting in watching silver itself is that from almost $50, 5 waves later, it was stopped at the 120DMA of just under $34. 5 waves after that, it reached just above $38. And 5 waves after that, it was again stopped at the 120DMA of just under $35. In the current cycle, it looks like the 3rd leg up was stopped at the 20DMA of around $36.50, and the current 4th leg down did not meet the support of the 120DMA. I use the words “wave” and “leg” similarly, and it is indeed presumptuous for commenting without having enough of an education yet but it is definitely at the top of my summer reading. Thanks again for posting your insights on this blog.

        Reply
        • Ramki on June 24, 2011 9:27 am

          Zen, Its my pleasure. Blessed is the trader who is able to tweak his own system to accomodate a bit of wave analysis, because he then has an enviable edge.

          Reply
  4. Bob D on July 14, 2011 2:01 pm

    Hello Ramki, appears as though ZSL has/is putting in end of “B” wave down here below $15.00 and now getting ready for the “C” wave up.. With the minimal upside target the May high of $24.49 and the downside risk of breaking the April low of $12.83 (SL) the risk reward appears very favorable. Strategically, does one wait for an advance and purchase on a 50% pullback? Or because of the oversold nature of this issue, can one /would one risk entry here?

    Reply

Leave A Reply Cancel Reply

Recent Posts
  • Has Meta (Facebook) stock seen the bottom
  • What Is The Nearest Technical Support For Meta (NASDAQ: FB)
  • Using Elliott Waves to Capture a Trade in S&P500
  • Hedge Funds and Elliott Waves – Netflix $NFLX
  • When Elliott Waves applauds the promoter’s signals!

WaveTimes is a Research Organization dedicated to providing original analysis, reports, reviews, and insights on developments in mutual funds, stocks, investing, foreign exchange, commodities, and bonds.

Contact WaveTimes

L-601 Mantri Espana,

Kariyammana Agrahara, Bellandur, Bangalore 560103

Follow Us

  • Facebook
  • YouTube
  • Twitter

© 2022 Wave Times. All Rights Reserved.
  • About
  • Books
  • Privacy Policy
  • Policies and Standards

Type above and press Enter to search. Press Esc to cancel.