• About
  • Elliott Waves
    • Elliott Waves Explained
    • Elliott Wave Magic Illustrated with Wave Charts
    • Elliott Wave Edge – How Elliott Wave Traders Win
    • Fibonacci Number Series and Elliott Waves
    • How to use Fibonacci Ratio Retracements
    • Elliott Wave Books
      • The Elliott Wave Book – Five Waves to Financial Freedom
      • Dividend Growth Investing Using Elliott Waves
    • Videos
  • Equities
    • Indices
      • Africa
        • Egypt
      • Australia
      • European Indices
        • AEX – Index, Amsterdam
        • DAX Index
        • Istanbul
        • Russia
        • Spain’s IBEX 35
      • Asian Indices
        • India
        • China
        • Dubai
        • Kuwait
        • Kuala Lumpur
        • Pakistan
        • Saudi
        • Taiwan
      • US Indices
        • S&P500
        • Nasdaq
        • Dow Jones
        • Dow Jones Utilities
    • Stocks
      • Asian Stocks
        • Indian Stocks Trading
        • Dubai Stocks Outlook
        • Japanese Stocks
        • Kuwait stocks
        • Saudi Stocks Outlook
      • African Stocks
        • Egyptian Stocks
      • Swiss Stocks
      • Australian Stocks
      • European Stocks
      • US Stocks outlook
      • UK Stocks
  • Commodities
    • Copper
    • Gasoline
    • Gold
    • Natural Gas
    • Oil
    • Palm Oil
    • Raw Sugar
    • Rubber
    • Soybean Oil
    • Silver
  • Forex
    • AUD
    • Bitcoin
    • CAD
    • CHF
    • Euro
    • GBP
    • INR
    • NZD
    • JPY
  • Raves
  • Consulting
    • Consulting
  • Ramki’s Watchlist
Top News

Has Meta (Facebook) stock seen the bottom

March 21, 2022

What Is The Nearest Technical Support For Meta (NASDAQ: FB)

February 7, 2022

Using Elliott Waves to Capture a Trade in S&P500

January 27, 2022
Facebook Twitter Instagram
WaveTimes Blog WaveTimes Blog
Wave times
  • About
  • Elliott Waves
    • Elliott Waves Explained
    • Elliott Wave Magic Illustrated with Wave Charts
    • Elliott Wave Edge – How Elliott Wave Traders Win
    • Fibonacci Number Series and Elliott Waves
    • How to use Fibonacci Ratio Retracements
    • Elliott Wave Books
      • The Elliott Wave Book – Five Waves to Financial Freedom
      • Dividend Growth Investing Using Elliott Waves
    • Videos
  • Equities
    • Indices
      • Africa
        • Egypt
      • Australia
      • European Indices
        • AEX – Index, Amsterdam
        • DAX Index
        • Istanbul
        • Russia
        • Spain’s IBEX 35
      • Asian Indices
        • India
        • China
        • Dubai
        • Kuwait
        • Kuala Lumpur
        • Pakistan
        • Saudi
        • Taiwan
      • US Indices
        • S&P500
        • Nasdaq
        • Dow Jones
        • Dow Jones Utilities
    • Stocks
      • Asian Stocks
        • Indian Stocks Trading
        • Dubai Stocks Outlook
        • Japanese Stocks
        • Kuwait stocks
        • Saudi Stocks Outlook
      • African Stocks
        • Egyptian Stocks
      • Swiss Stocks
      • Australian Stocks
      • European Stocks
      • US Stocks outlook
      • UK Stocks
  • Commodities
    • Copper
    • Gasoline
    • Gold
    • Natural Gas
    • Oil
    • Palm Oil
    • Raw Sugar
    • Rubber
    • Soybean Oil
    • Silver
  • Forex
    • AUD
    • Bitcoin
    • CAD
    • CHF
    • Euro
    • GBP
    • INR
    • NZD
    • JPY
  • Raves
  • Consulting
    • Consulting
  • Ramki’s Watchlist
WaveTimes Blog WaveTimes Blog
Home » Elliott Wave Analysis of Wockhardt Ltd
India

Elliott Wave Analysis of Wockhardt Ltd

RamkiBy RamkiApril 23, 201413 Comments3 Mins Read
Facebook Twitter LinkedIn Telegram Pinterest Tumblr Reddit WhatsApp Email
Share
Facebook Twitter LinkedIn Pinterest Email

In this post, I am going to present you with Elliott Wave analysis of Wockhardt Ltd. One of the members of my exclusive club had approached me for a consultation back in January 2014. It was the 14th of January, to be precise, and the stock was trading at Rs 413.65. The member sent me the following brief note:

“I consider myself as long term investor. I hope your advice/analysis will help in some of my long term investment decisions. By long term I mean I could hold for more than a year, if required.

Could you please look into the following stock for me: (I understand this will cost me 2 credits)
Market – India – NSE
Company – Wockhardt limited
Symbol – WOCKPHARMA
Exposure – None at this time.

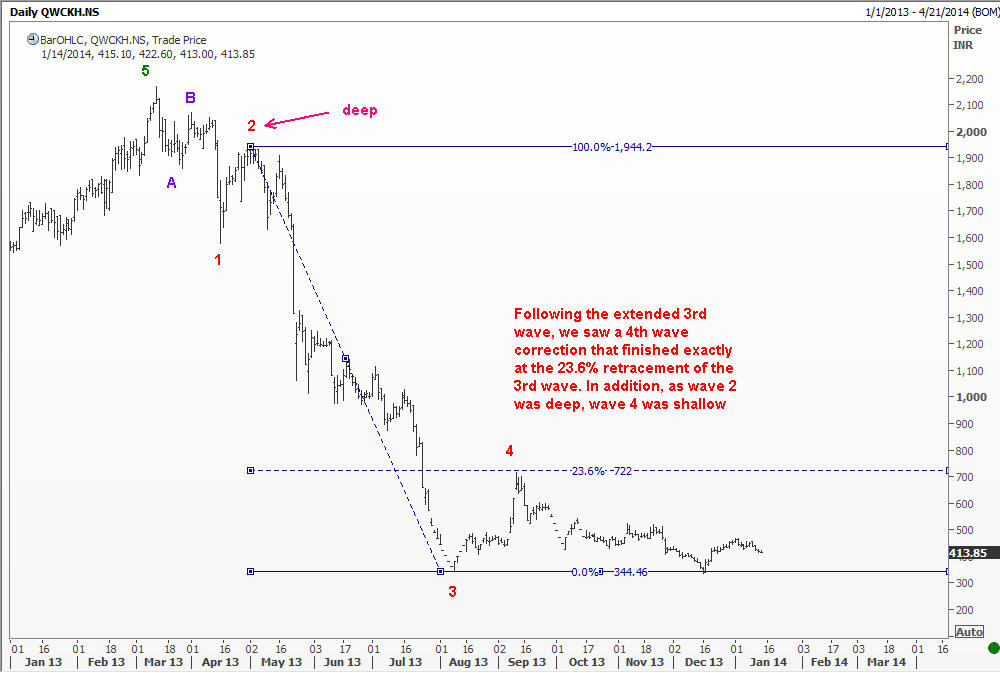
Comment: This stock has comedown from around Rs. 2000 and currently trading at 420. It saw a low of 350 about 3 weeks back. Did it start its uptrend? Since the company is in pharma industry, it is subjected to lot of FDA regulations. I think FDA’s adverse observations made the stock to drop in recent times.”

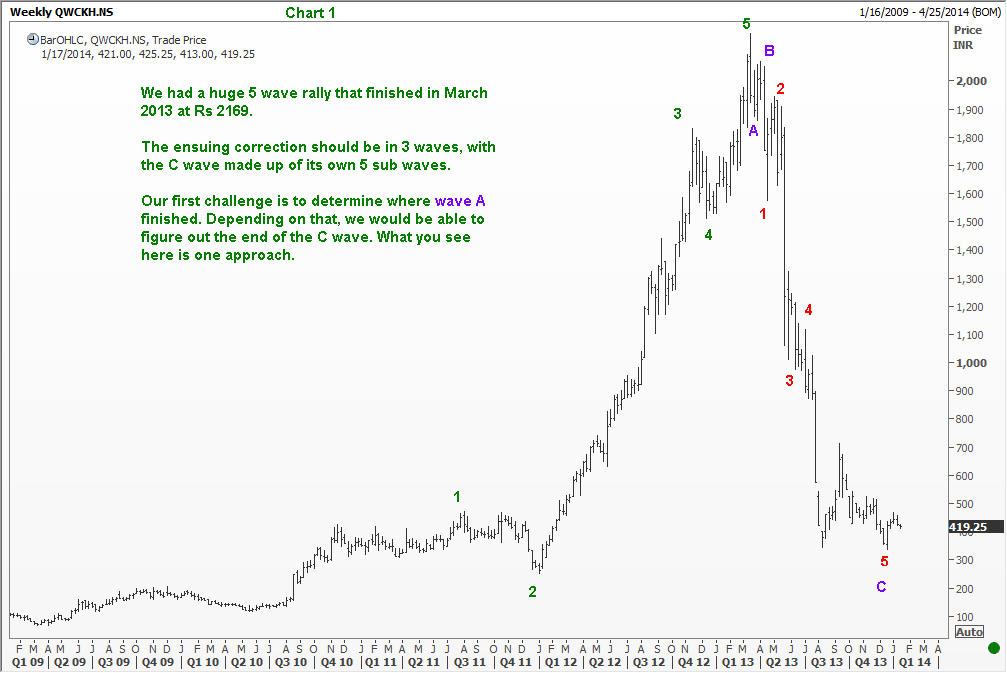
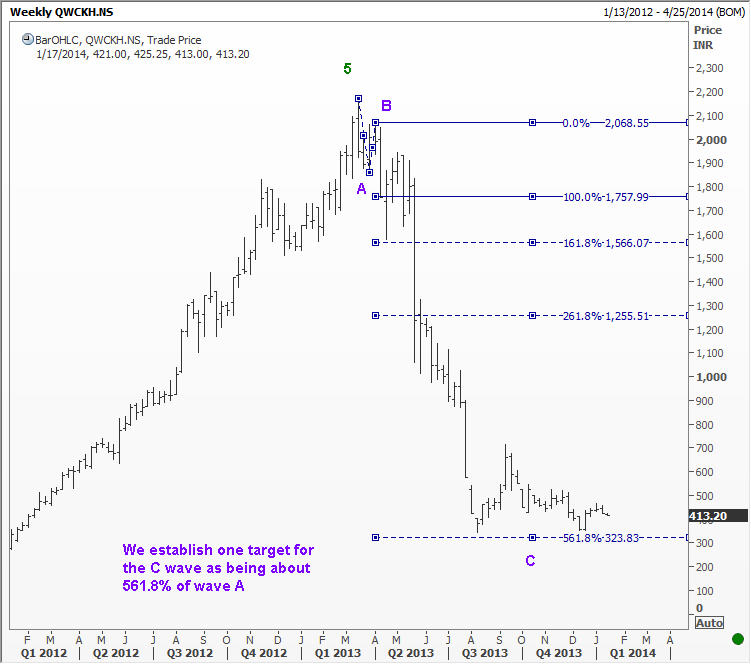
I looked at the chart, and could make out that it was going to be a challenge to come up with a sound analysis. I prepared a set of 10 charts and will share with you some of them here. Please note that this is not a marketing message. The idea is to allow readers to see the value of Elliott Wave analysis, and how someone with experience with Elliott Waves could come up with a sound strategy. I recommend that you open the charts in different tabs.

Wockhardt Big Picture
Wockhardt Big Picture Elliott Waves
Wockhardt First Target for C wave
3rd wave target within the C wave
Verifying 4th wave as correct
Identifying possible end of wave 5
Analyzing minor waves of wave 5

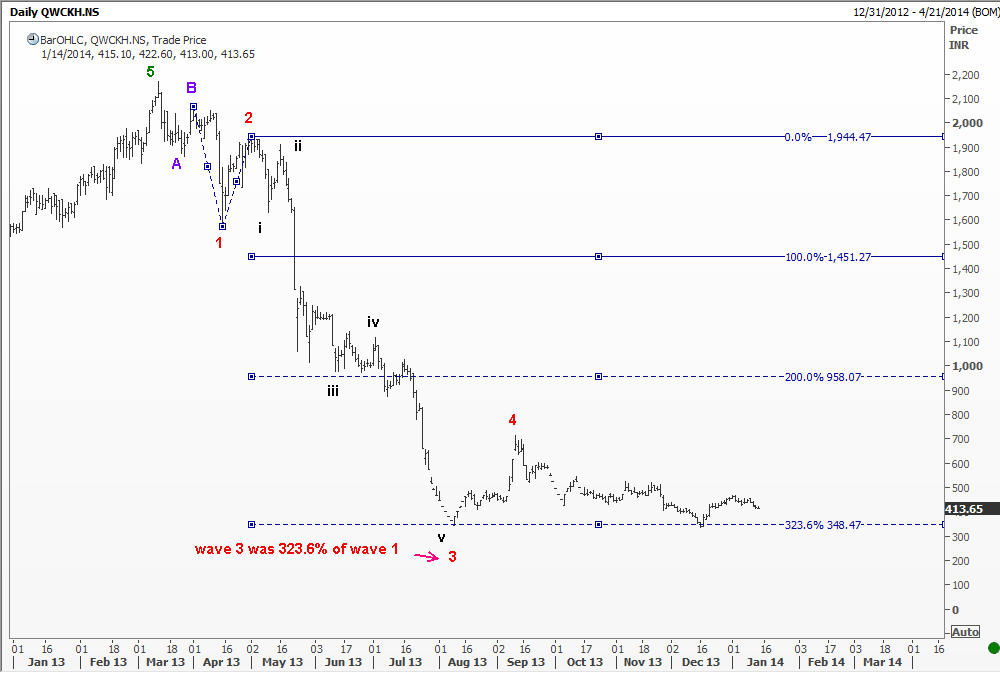
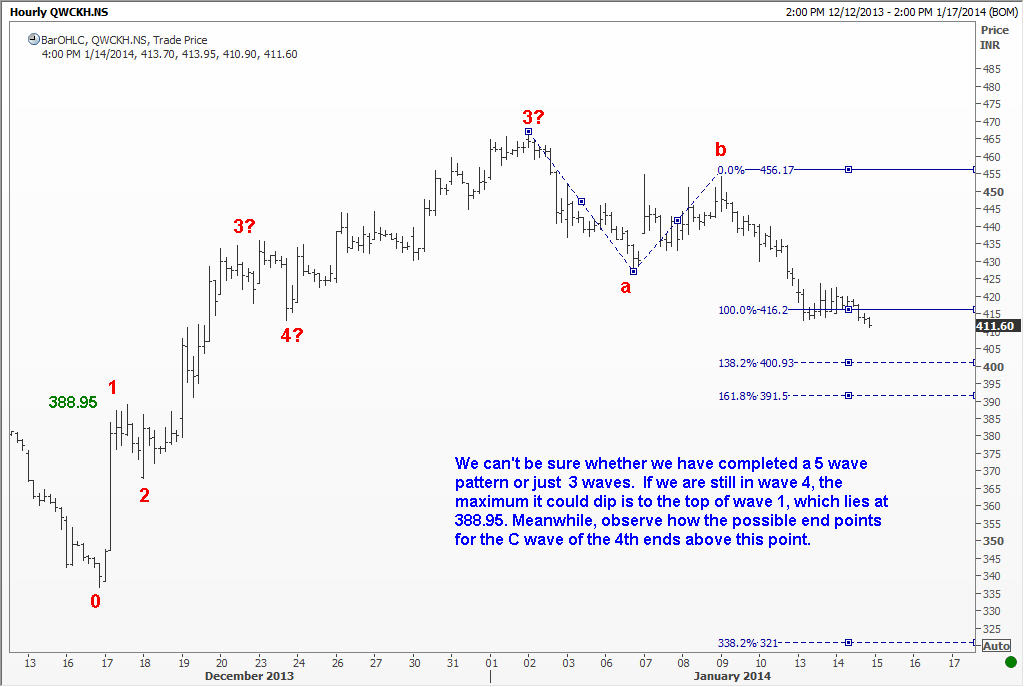
As can be seen from the above, I have finally come to the conclusion that a major correction is now over, and the rally that started off from that low is the first wave of a new cycle. Now comes the more interesting part, the one about where to buy.

Have we finished 5 waves of wave 1?

WCKH-10-14Jan14

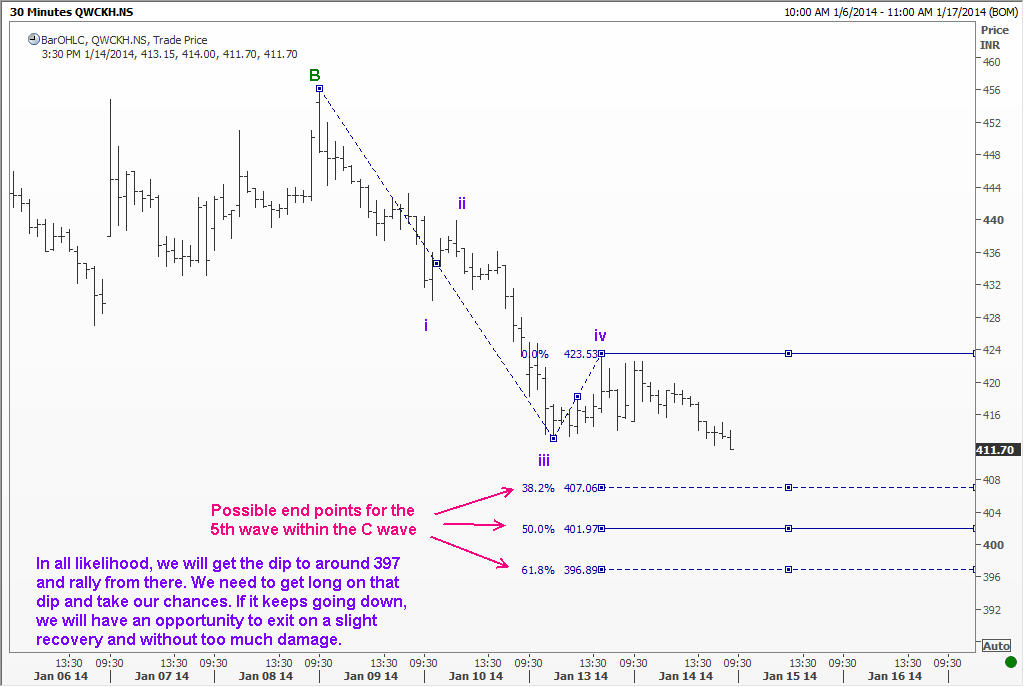
So we have identified a low-risk entry point. However, there were other considerations like risk-management and what size to expose. Yet, an initial entry point has been identified.

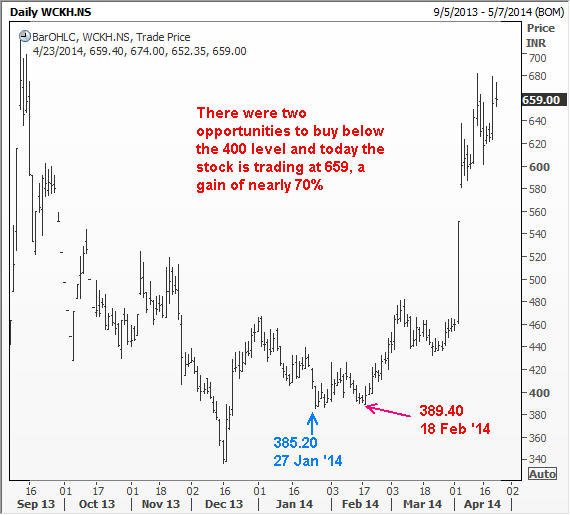
This member went long a decent position size at an average rate of 430. He probably purchased some on the way up after the dip, a smart investor I must say. He understood the size of the upcoming recovery, and wasn’t penny wise when it was the right time to take a risk. A majority of traders do the opposite. They take big risks when they should be cautious, and take small risks when everything points to a favorable move! Anyway, this is what happened. I am sharing with you just the plain chart without any notations. We got a dip down to below the 400 mark twice in the days that followed and the stock is up by nearly 70%.

The power of Elliott Waves
Elliott Wave Analysis of Wockhardt
Share. Facebook Twitter Pinterest LinkedIn Tumblr Telegram Email
Previous ArticleElliott Wave Analysis and Seth Klarman’s call on Tesla Motors
Next Article Elliott Wave Analysis of Alliant Energy Corporation (NYSE: LNT)
Ramki
  • Website

Related Posts

How Elliott Waves helped WaveTimes members to exit before the stock market crash

March 27, 2020

How we traded Castrol India using Elliott Waves

December 9, 2019

Nifty rallied up in 5 waves

July 10, 2015
View 13 Comments

13 Comments

  1. Yogesh on April 23, 2014 7:16 pm

    .I was thinking that wave C cant retrace more than 161.8% of wave A.

    Reply
    • Ramki Ramakrishnan on April 24, 2014 8:46 pm

      Yogesh, Well now you know! C waves can certainly travel more than that. And this is why you got to be careful when picking a bottom in a C wave sell off.

      Reply
      • Yogesh on May 9, 2014 5:17 pm

        Thanks Ramki Sir for reply , now my doubt got solved.C wave is best wave to trade :). .

        But Sir i need to learn about some complex or irregular corrections . Cause i sometime think wave ii or wave iv ended as normal a-b-c in impulse structure.

        Then it fools you by moving up then again coming back to the territory of a-b-c where we marked end.

        Then its really tough to handle this part.

        Even counting tiny waves inside it gets confuse

        I just marked 5 wave end on nifty and then it went down making 4 wave end…later it traveled like 5th wave.

        just want to know how to handle this part.

        Reply
  2. Mahesh on April 23, 2014 8:10 pm

    Hi Ramki, The charts are very educational. Thanks for sharing them with us. Wavetimes makes the knowledge in your book come to life and for that I am eternally grateful to you Sir.

    I have 2 question:
    1. Why have you labelled the corrective waves A B C in different color than the five waves up? Is the A B C of different degree?
    2. The waves A and B are microscopic compared to C. Although your count appears to be perfect it is not something that is obvious as generally people will look for proportionate A B C. It will be immensely useful to me if you can share any aspect (which a novice like me has overlooked) that made you arrive at that count.

    Thank you again for sharing this living, breathing example with us as we all are wiser having read it.

    Reply
    • Ramki Ramakrishnan on April 24, 2014 8:44 pm

      Mahesh, This blog exists to help people embrace Elliott Waves, and I believe knowledge should be shared. If you tell your friends, they too will benefit. Even my book is priced ridiculously to enable everyone to afford it. As for the color coding, there is no rule being followed here. I am only trying to differentiate between different degrees to help your understanding. Finally, I am aware that wave A and B are unusually short compared to wave C. But who are we to dictate to the markets? And more importantly, it worked! The goal of all analysis is to make money. And there are people who have made money of this.

      Reply
  3. R Sathyamurthy on April 24, 2014 7:08 am

    Dear Sir,

    Nice analysis. Hope you have also identified the long term targets.

    Best Regards
    R Sathyamurthy

    Reply
  4. Shiva on April 25, 2014 10:31 am

    Very educative analysis.

    Reply
    • Ramki Ramakrishnan on April 29, 2014 8:39 pm

      Shiva, Glad to see you find it useful.

      Reply
  5. Joe Hentges on April 28, 2014 7:45 pm

    Ramki, thank you for the great series of charts, that really was very educational.
    Your identification of A and B waves is one big lesson for me. It is a constant learning process.
    That 61.8% projection for wave 5 of C was beautiful. I do love that methodology from your book.
    Thanks again!
    Joe

    Reply
    • Ramki Ramakrishnan on April 29, 2014 8:38 pm

      Joe, Thanks for writing. I am glad you like my book as well. Best.

      Reply
  6. Larry duchonvy on May 5, 2014 6:29 pm

    Ramki, I noticed that wave A only has 3 subwaves but ABC is not a flat but a zig-zag. Usually when it is 3-3-5 it should be a flat. Are we upon a new pattern here?

    Reply
  7. prabh on May 18, 2014 9:20 pm

    Ramki Sir,

    Can you post your expert opinion of Elliot Wave analysis on LT indian stock.This stock is one of the Infra stock and very difficult to predict but with your strong experience on Elliot wave if you can post some charts then its going to be very helpful.

    Reply
    • Ramki Ramakrishnan on May 19, 2014 6:27 pm

      Prabh, Thank you for writing. This blog is now dedicated to teaching people how to use Elliott Waves.

      Reply

Leave A Reply Cancel Reply

Recent Posts
  • Has Meta (Facebook) stock seen the bottom
  • What Is The Nearest Technical Support For Meta (NASDAQ: FB)
  • Using Elliott Waves to Capture a Trade in S&P500
  • Hedge Funds and Elliott Waves – Netflix $NFLX
  • When Elliott Waves applauds the promoter’s signals!

WaveTimes is a Research Organization dedicated to providing original analysis, reports, reviews, and insights on developments in mutual funds, stocks, investing, foreign exchange, commodities, and bonds.

Contact WaveTimes

L-601 Mantri Espana,

Kariyammana Agrahara, Bellandur, Bangalore 560103

Follow Us

  • Facebook
  • YouTube
  • Twitter

© 2023 Wave Times. All Rights Reserved.
  • About
  • Books
  • Privacy Policy
  • Policies and Standards

Type above and press Enter to search. Press Esc to cancel.