• About
  • Elliott Waves
    • Elliott Waves Explained
    • Elliott Wave Magic Illustrated with Wave Charts
    • Elliott Wave Edge – How Elliott Wave Traders Win
    • Fibonacci Number Series and Elliott Waves
    • How to use Fibonacci Ratio Retracements
    • Elliott Wave Books
      • The Elliott Wave Book – Five Waves to Financial Freedom
      • Dividend Growth Investing Using Elliott Waves
    • Videos
  • Equities
    • Indices
      • Africa
        • Egypt
      • Australia
      • European Indices
        • AEX – Index, Amsterdam
        • DAX Index
        • Istanbul
        • Russia
        • Spain’s IBEX 35
      • Asian Indices
        • India
        • China
        • Dubai
        • Kuwait
        • Kuala Lumpur
        • Pakistan
        • Saudi
        • Taiwan
      • US Indices
        • S&P500
        • Nasdaq
        • Dow Jones
        • Dow Jones Utilities
    • Stocks
      • Asian Stocks
        • Indian Stocks Trading
        • Dubai Stocks Outlook
        • Japanese Stocks
        • Kuwait stocks
        • Saudi Stocks Outlook
      • African Stocks
        • Egyptian Stocks
      • Swiss Stocks
      • Australian Stocks
      • European Stocks
      • US Stocks outlook
      • UK Stocks
  • Commodities
    • Copper
    • Gasoline
    • Gold
    • Natural Gas
    • Oil
    • Palm Oil
    • Raw Sugar
    • Rubber
    • Soybean Oil
    • Silver
  • Forex
    • AUD
    • Bitcoin
    • CAD
    • CHF
    • Euro
    • GBP
    • INR
    • NZD
    • JPY
  • Raves
  • Consulting
    • Consulting
  • Ramki’s Watchlist
Top News

Has Meta (Facebook) stock seen the bottom

March 21, 2022

What Is The Nearest Technical Support For Meta (NASDAQ: FB)

February 7, 2022

Using Elliott Waves to Capture a Trade in S&P500

January 27, 2022
Facebook Twitter Instagram
WaveTimes Blog WaveTimes Blog
Wave times
  • About
  • Elliott Waves
    • Elliott Waves Explained
    • Elliott Wave Magic Illustrated with Wave Charts
    • Elliott Wave Edge – How Elliott Wave Traders Win
    • Fibonacci Number Series and Elliott Waves
    • How to use Fibonacci Ratio Retracements
    • Elliott Wave Books
      • The Elliott Wave Book – Five Waves to Financial Freedom
      • Dividend Growth Investing Using Elliott Waves
    • Videos
  • Equities
    • Indices
      • Africa
        • Egypt
      • Australia
      • European Indices
        • AEX – Index, Amsterdam
        • DAX Index
        • Istanbul
        • Russia
        • Spain’s IBEX 35
      • Asian Indices
        • India
        • China
        • Dubai
        • Kuwait
        • Kuala Lumpur
        • Pakistan
        • Saudi
        • Taiwan
      • US Indices
        • S&P500
        • Nasdaq
        • Dow Jones
        • Dow Jones Utilities
    • Stocks
      • Asian Stocks
        • Indian Stocks Trading
        • Dubai Stocks Outlook
        • Japanese Stocks
        • Kuwait stocks
        • Saudi Stocks Outlook
      • African Stocks
        • Egyptian Stocks
      • Swiss Stocks
      • Australian Stocks
      • European Stocks
      • US Stocks outlook
      • UK Stocks
  • Commodities
    • Copper
    • Gasoline
    • Gold
    • Natural Gas
    • Oil
    • Palm Oil
    • Raw Sugar
    • Rubber
    • Soybean Oil
    • Silver
  • Forex
    • AUD
    • Bitcoin
    • CAD
    • CHF
    • Euro
    • GBP
    • INR
    • NZD
    • JPY
  • Raves
  • Consulting
    • Consulting
  • Ramki’s Watchlist
WaveTimes Blog WaveTimes Blog
Home » Elliott Wave Analysis of Wipro Ltd
Indian Stocks Trading

Elliott Wave Analysis of Wipro Ltd

RamkiBy RamkiFebruary 13, 20126 Comments1 Min Read
Facebook Twitter LinkedIn Telegram Pinterest Tumblr Reddit WhatsApp Email
Share
Facebook Twitter LinkedIn Pinterest Email

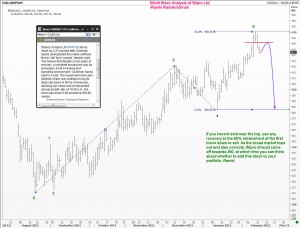
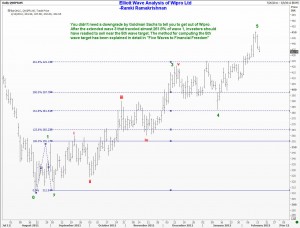
Elliott Wave analysis of Wipro (WIT) should have warned you that the stock was close to a near term top. A five wave move was completed at 450.45 on Feb 10th, and the Goldman Sachs downgrade was the trigger for the ordinary investor to sell. But as you are a believer in the power of Elliott Waves, you would have anticipated that the stock was ripe for a correction, and could potentially give back 50% of its recent gains. This ELliott Wave lesson has been repeated in hundreds of examples in WaveTimes. Also, your investment in the Elliott Wave book, Five Waves to Financial Freedom would have paid back handsomely because you now have in your armoury simple but effective tools to anticipate market turns. At the very least you won’t be exposed to nasty surprises. Elliott Wave analysis of Wipro LtdElliott Wave would allow you to anticipate market turns
elliott wave book Wipro WIT
Share. Facebook Twitter Pinterest LinkedIn Tumblr Telegram Email
Previous ArticleElliott Wave Analysis of EUR/USD (EURUSD=X) – ccy
Next Article Elliott Wave Analysis of Verizon Communications
Ramki
  • Website

Related Posts

When Elliott Waves applauds the promoter’s signals!

January 3, 2022

A soft quarter for TCS – Avoid or Add – Contd.

October 13, 2021

A soft quarter for TCS — Avoid or add?

October 12, 2021
View 6 Comments

6 Comments

  1. ritesh on February 14, 2012 4:59 am

    thankz ramki sir your valuable view on wipro.please post your views on nifty we are waiting.

    Reply
  2. ahmed khalifa on February 14, 2012 11:32 am

    very good ramki , your view is very helpfull

    Reply
  3. Sandeep Didwania on February 15, 2012 10:08 am

    Ramki Sir your analysis of WIPRO is very helpful. I am new to EW and has been going through ur website since last few days and gradually getting nick of EW. You are requested to post your analysis on NIFTY

    Reply
  4. salimkabani on February 15, 2012 9:15 pm

    sir
    Bank nifty touched 10960 from 7766 low and all time high is 13300. Please share ur views for bank nifty.
    Thanks

    Reply
  5. vd on February 17, 2012 6:50 am

    Wipro made a fresh high of 453 and closed 449

    Reply
  6. RamV on February 17, 2012 6:54 am

    Dear Ramki,

    Thanks for the post. Today, Wipro went as high as 453, couple of points more than previous high of 450.45.

    This is how I am interpreting this move. Would you please let us know if this is correct?

    As of yesterday closing
    1) Wave 5 ended at 450.45.
    2) Wave 1 of corrective Wave started at 450.45 and ended at 439.75
    3) Wave 2 of Wave A started at 439.75

    As of today closing
    1) Wave 2 shouldn’t cross the beginning of Wave1 – This got violated today
    2) Conclusion – Still the Wave 5 is continuing, corrective wave hasn’t started.

    Appreciate your help!

    Regards,
    –Ram V

    Reply

Leave A Reply Cancel Reply

Recent Posts
  • Has Meta (Facebook) stock seen the bottom
  • What Is The Nearest Technical Support For Meta (NASDAQ: FB)
  • Using Elliott Waves to Capture a Trade in S&P500
  • Hedge Funds and Elliott Waves – Netflix $NFLX
  • When Elliott Waves applauds the promoter’s signals!

WaveTimes is a Research Organization dedicated to providing original analysis, reports, reviews, and insights on developments in mutual funds, stocks, investing, foreign exchange, commodities, and bonds.

Contact WaveTimes

L-601 Mantri Espana,

Kariyammana Agrahara, Bellandur, Bangalore 560103

Follow Us

  • Facebook
  • YouTube
  • Twitter

© 2023 Wave Times. All Rights Reserved.
  • About
  • Books
  • Privacy Policy
  • Policies and Standards

Type above and press Enter to search. Press Esc to cancel.