• About
  • Elliott Waves
    • Elliott Waves Explained
    • Elliott Wave Magic Illustrated with Wave Charts
    • Elliott Wave Edge – How Elliott Wave Traders Win
    • Fibonacci Number Series and Elliott Waves
    • How to use Fibonacci Ratio Retracements
    • Elliott Wave Books
      • The Elliott Wave Book – Five Waves to Financial Freedom
      • Dividend Growth Investing Using Elliott Waves
    • Videos
  • Equities
    • Indices
      • Africa
        • Egypt
      • Australia
      • European Indices
        • AEX – Index, Amsterdam
        • DAX Index
        • Istanbul
        • Russia
        • Spain’s IBEX 35
      • Asian Indices
        • India
        • China
        • Dubai
        • Kuwait
        • Kuala Lumpur
        • Pakistan
        • Saudi
        • Taiwan
      • US Indices
        • S&P500
        • Nasdaq
        • Dow Jones
        • Dow Jones Utilities
    • Stocks
      • Asian Stocks
        • Indian Stocks Trading
        • Dubai Stocks Outlook
        • Japanese Stocks
        • Kuwait stocks
        • Saudi Stocks Outlook
      • African Stocks
        • Egyptian Stocks
      • Swiss Stocks
      • Australian Stocks
      • European Stocks
      • US Stocks outlook
      • UK Stocks
  • Commodities
    • Copper
    • Gasoline
    • Gold
    • Natural Gas
    • Oil
    • Palm Oil
    • Raw Sugar
    • Rubber
    • Soybean Oil
    • Silver
  • Forex
    • AUD
    • Bitcoin
    • CAD
    • CHF
    • Euro
    • GBP
    • INR
    • NZD
    • JPY
  • Raves
  • Consulting
    • Consulting
  • Ramki’s Watchlist
Top News

Has Meta (Facebook) stock seen the bottom

March 21, 2022

What Is The Nearest Technical Support For Meta (NASDAQ: FB)

February 7, 2022

Using Elliott Waves to Capture a Trade in S&P500

January 27, 2022
Facebook Twitter Instagram
WaveTimes Blog WaveTimes Blog
Wave times
  • About
  • Elliott Waves
    • Elliott Waves Explained
    • Elliott Wave Magic Illustrated with Wave Charts
    • Elliott Wave Edge – How Elliott Wave Traders Win
    • Fibonacci Number Series and Elliott Waves
    • How to use Fibonacci Ratio Retracements
    • Elliott Wave Books
      • The Elliott Wave Book – Five Waves to Financial Freedom
      • Dividend Growth Investing Using Elliott Waves
    • Videos
  • Equities
    • Indices
      • Africa
        • Egypt
      • Australia
      • European Indices
        • AEX – Index, Amsterdam
        • DAX Index
        • Istanbul
        • Russia
        • Spain’s IBEX 35
      • Asian Indices
        • India
        • China
        • Dubai
        • Kuwait
        • Kuala Lumpur
        • Pakistan
        • Saudi
        • Taiwan
      • US Indices
        • S&P500
        • Nasdaq
        • Dow Jones
        • Dow Jones Utilities
    • Stocks
      • Asian Stocks
        • Indian Stocks Trading
        • Dubai Stocks Outlook
        • Japanese Stocks
        • Kuwait stocks
        • Saudi Stocks Outlook
      • African Stocks
        • Egyptian Stocks
      • Swiss Stocks
      • Australian Stocks
      • European Stocks
      • US Stocks outlook
      • UK Stocks
  • Commodities
    • Copper
    • Gasoline
    • Gold
    • Natural Gas
    • Oil
    • Palm Oil
    • Raw Sugar
    • Rubber
    • Soybean Oil
    • Silver
  • Forex
    • AUD
    • Bitcoin
    • CAD
    • CHF
    • Euro
    • GBP
    • INR
    • NZD
    • JPY
  • Raves
  • Consulting
    • Consulting
  • Ramki’s Watchlist
WaveTimes Blog WaveTimes Blog
Home » Elliott Wave Analysis of WalMart
US Stocks outlook

Elliott Wave Analysis of WalMart

RamkiBy RamkiNovember 6, 20156 Comments2 Mins Read
Facebook Twitter LinkedIn Telegram Pinterest Tumblr Reddit WhatsApp Email
Share
Facebook Twitter LinkedIn Pinterest Email

I will post you a couple of charts that I prepared for my old friend Bob D (remember the person who gave me so much of his valuable time in proof reading your favorite book, Five Waves to Financial Freedom?)
With Elliott Waves, you should never struggle to count the waves. When it becomes hard, just step back and look at the bigger picture. The best trades are done when you are able to see the waves easily and clearly, while the rest of the world is stressing out about the next few points. You, on the other hand, having read and understood my way of approaching the market, would place your bids or offers near the anticipated targets and wait for the fruit to land on your lap! Of course, occasionally you will get a lemon, but often enough it will be a sweet fruit.

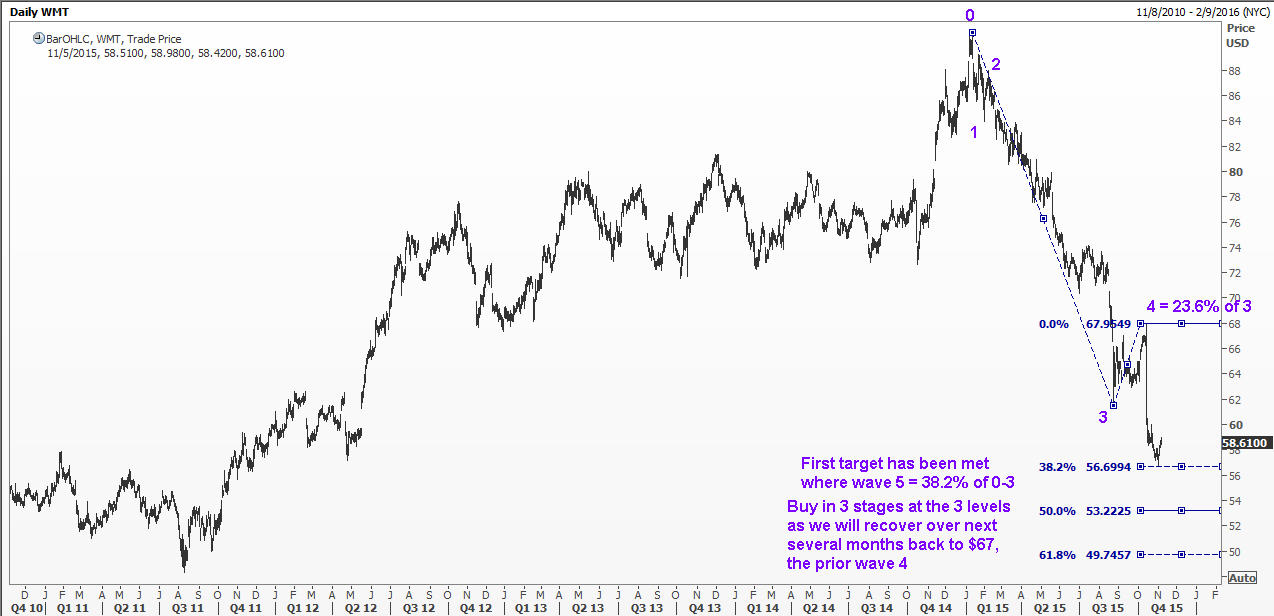
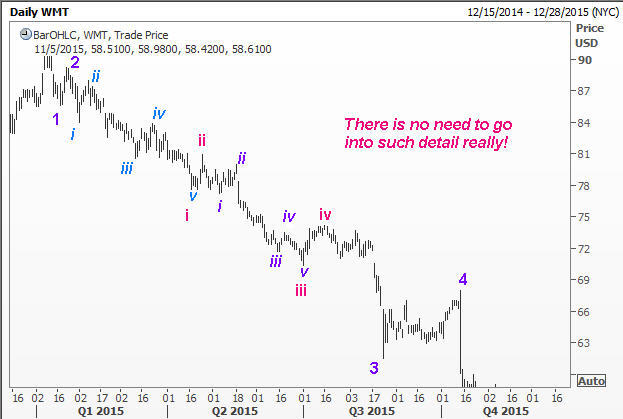
Here are the Elliott Wave charts of WalMart. The second chart shows the third wave in detail. As I point out, you really don’t need to go very deep! Just keep it simple. All the best.

The Fifth Wave of Wall Mart has met its initial target
The Fifth Wave of WalMart has met its initial target

Each impulse wave is made up of five sub waves
Sub waves inside the third wave of WalMart
Elliott Wave walmart WMT
Share. Facebook Twitter Pinterest LinkedIn Tumblr Telegram Email
Previous ArticleElliott Wave analysis of Egypt’s Equity Index EGX30 September 2015
Next Article Elliott Wave Analysis of Silver – Multi Commodity Exchange of India
Ramki
  • Website

Related Posts

Has Meta (Facebook) stock seen the bottom

March 21, 2022

What Is The Nearest Technical Support For Meta (NASDAQ: FB)

February 7, 2022

Hedge Funds and Elliott Waves – Netflix $NFLX

January 17, 2022
View 6 Comments

6 Comments

  1. Bob D on November 6, 2015 4:56 pm

    Dear Ramki….as is usually the case, I marvel at your ability to view stock price movement and decipher the human emotions attached to the “current state of the issue” by applying Elliott Wave analysis. The potential road map you provide for us students of EW analysis, is like having an air traffic controller guide us through a menacing storm. I can now see clear skies ahead, as I home in on WMT. Thank you for your continuing kindness. Good fortune….Bob D.

    Reply
    • Ramki Ramakrishnan on November 6, 2015 10:03 pm

      Hi Bob, Thank you for posting on WaveTimes. My closest friends have been found via this blog, and you are a special person in that group.

      Reply
  2. Bob D on February 1, 2016 7:18 pm

    Hello Ramki……as suggested in your analysis of WMT, price has reached $67.00 today. From the $56 low in November 2015, thru to todays price of $67.00, that ROI is 19.64%. Marvelous…..simply marvelous. Thank you for your skillful EW analysis.
    Good fortune,
    Bob D

    Reply
    • Ramki Ramakrishnan on February 8, 2016 7:13 pm

      Bob, I am glad you followed that trade. All the best.

      Reply
  3. Farid on February 12, 2016 4:51 pm

    Hello Mr Ramki. I just have one question about this chart. So, can 0-2 trendline be brokern by the wave 3 ?
    Thanks in advance

    Reply
    • Ramki Ramakrishnan on February 18, 2016 8:56 pm

      HI Farid, I suspect that you are looking at the dotted line in the chart and thinking it is a trend line that I have drawn. It isn’t. The line only shows the path I have taken to connect the point 0 to point 3, which is a straight line. I recommend that you read the section dealing with use of Elliott Wave channels in any good book. FWTFF also covers this concept.

      Reply

Leave A Reply Cancel Reply

Recent Posts
  • Has Meta (Facebook) stock seen the bottom
  • What Is The Nearest Technical Support For Meta (NASDAQ: FB)
  • Using Elliott Waves to Capture a Trade in S&P500
  • Hedge Funds and Elliott Waves – Netflix $NFLX
  • When Elliott Waves applauds the promoter’s signals!

WaveTimes is a Research Organization dedicated to providing original analysis, reports, reviews, and insights on developments in mutual funds, stocks, investing, foreign exchange, commodities, and bonds.

Contact WaveTimes

L-601 Mantri Espana,

Kariyammana Agrahara, Bellandur, Bangalore 560103

Follow Us

  • Facebook
  • YouTube
  • Twitter

© 2022 Wave Times. All Rights Reserved.
  • About
  • Books
  • Privacy Policy
  • Policies and Standards

Type above and press Enter to search. Press Esc to cancel.