I thought it might be a good idea to present Elliott Wave analysis of Verizon Communications as this stock has come to the attention of some investment managers, possibly because of roll out and quality of its FiOS fiber-optic product (in addition to the company’s generous dividend yield!).

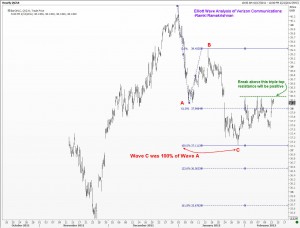
The first chart is a very short term hourly chart of Verizon communications, and it shows that wave C was exactly equal to wave A. You should be able to spot the five minor waves inside of the C wave by yourself. Any investor who notices the development of the fifth wave within the C wave should be on alert to buy the stock. This has also been demonstarted in my article on Forbes today. Coming back to the first chart here, we see several tops at the dashed green line, and if that can be broken, expect a quick run higher.

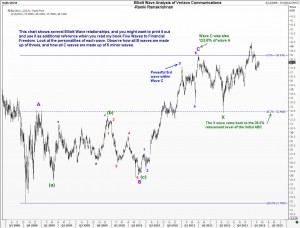
The second chart is a daily chart of Verizon, and it shows several elliott wave relationships between the various waves.Observe that every C wave is made up of 5 waves, and when such a move finished, we got a sharp move in the opposite direction. All this has been explained in detail in my book “Five Waves to Financial Freedom” in easy to understand language.
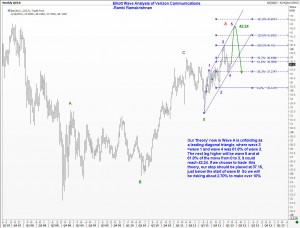
The third chart is a weekly chart of Verizon Communications and I am professing that the new wave A (in red color) is likely to carry on towards $42.24. We are currently trading around 38.13, and if you get any dip, you may consider a low-risk trade by buying with a stop at $37.15. The risk-reward ratio looks attractive also. Later on, if and when we reach $42.24, we should look out for a nice correction back to the $37 level.

