• About
  • Elliott Waves
    • Elliott Waves Explained
    • Elliott Wave Magic Illustrated with Wave Charts
    • Elliott Wave Edge – How Elliott Wave Traders Win
    • Fibonacci Number Series and Elliott Waves
    • How to use Fibonacci Ratio Retracements
    • Elliott Wave Books
      • The Elliott Wave Book – Five Waves to Financial Freedom
      • Dividend Growth Investing Using Elliott Waves
    • Videos
  • Equities
    • Indices
      • Africa
        • Egypt
      • Australia
      • European Indices
        • AEX – Index, Amsterdam
        • DAX Index
        • Istanbul
        • Russia
        • Spain’s IBEX 35
      • Asian Indices
        • India
        • China
        • Dubai
        • Kuwait
        • Kuala Lumpur
        • Pakistan
        • Saudi
        • Taiwan
      • US Indices
        • S&P500
        • Nasdaq
        • Dow Jones
        • Dow Jones Utilities
    • Stocks
      • Asian Stocks
        • Indian Stocks Trading
        • Dubai Stocks Outlook
        • Japanese Stocks
        • Kuwait stocks
        • Saudi Stocks Outlook
      • African Stocks
        • Egyptian Stocks
      • Swiss Stocks
      • Australian Stocks
      • European Stocks
      • US Stocks outlook
      • UK Stocks
  • Commodities
    • Copper
    • Gasoline
    • Gold
    • Natural Gas
    • Oil
    • Palm Oil
    • Raw Sugar
    • Rubber
    • Soybean Oil
    • Silver
  • Forex
    • AUD
    • Bitcoin
    • CAD
    • CHF
    • Euro
    • GBP
    • INR
    • NZD
    • JPY
  • Raves
  • Consulting
    • Consulting
  • Ramki’s Watchlist
Top News

Has Meta (Facebook) stock seen the bottom

March 21, 2022

What Is The Nearest Technical Support For Meta (NASDAQ: FB)

February 7, 2022

Using Elliott Waves to Capture a Trade in S&P500

January 27, 2022
Facebook Twitter Instagram
WaveTimes Blog WaveTimes Blog
Wave times
  • About
  • Elliott Waves
    • Elliott Waves Explained
    • Elliott Wave Magic Illustrated with Wave Charts
    • Elliott Wave Edge – How Elliott Wave Traders Win
    • Fibonacci Number Series and Elliott Waves
    • How to use Fibonacci Ratio Retracements
    • Elliott Wave Books
      • The Elliott Wave Book – Five Waves to Financial Freedom
      • Dividend Growth Investing Using Elliott Waves
    • Videos
  • Equities
    • Indices
      • Africa
        • Egypt
      • Australia
      • European Indices
        • AEX – Index, Amsterdam
        • DAX Index
        • Istanbul
        • Russia
        • Spain’s IBEX 35
      • Asian Indices
        • India
        • China
        • Dubai
        • Kuwait
        • Kuala Lumpur
        • Pakistan
        • Saudi
        • Taiwan
      • US Indices
        • S&P500
        • Nasdaq
        • Dow Jones
        • Dow Jones Utilities
    • Stocks
      • Asian Stocks
        • Indian Stocks Trading
        • Dubai Stocks Outlook
        • Japanese Stocks
        • Kuwait stocks
        • Saudi Stocks Outlook
      • African Stocks
        • Egyptian Stocks
      • Swiss Stocks
      • Australian Stocks
      • European Stocks
      • US Stocks outlook
      • UK Stocks
  • Commodities
    • Copper
    • Gasoline
    • Gold
    • Natural Gas
    • Oil
    • Palm Oil
    • Raw Sugar
    • Rubber
    • Soybean Oil
    • Silver
  • Forex
    • AUD
    • Bitcoin
    • CAD
    • CHF
    • Euro
    • GBP
    • INR
    • NZD
    • JPY
  • Raves
  • Consulting
    • Consulting
  • Ramki’s Watchlist
WaveTimes Blog WaveTimes Blog
Home » Elliott Wave Analysis of USDINR Indian Rupee
Inr

Elliott Wave Analysis of USDINR Indian Rupee

RamkiBy RamkiSeptember 18, 201124 Comments1 Min Read
Facebook Twitter LinkedIn Telegram Pinterest Tumblr Reddit WhatsApp Email
Share
Facebook Twitter LinkedIn Pinterest Email

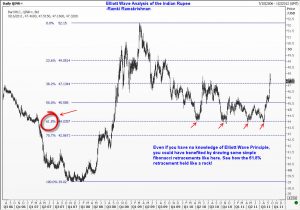
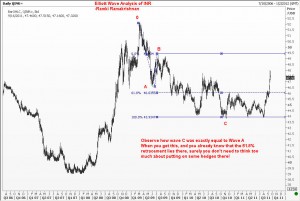
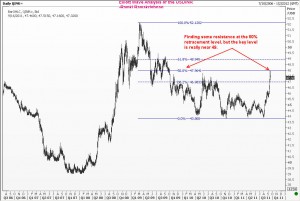
There have been many calls for an analysis of the Indian Rupee, which has recently seen a bout of weakness. I am often amazed at how importers and exporters alike are not able to take simple decisions about hedging at certain levels which make a compelling case for action. Perhaps they are misled by the cacophony of trader-like recommendations coming from banks and brokers that are seeking to get more deals on their books! Take a look at the three charts here, and you will see that any treasurer or finance manager should have been advised to act when the INR was near 44 levels. Ramki

Exporter Hedging INR Importer Indian Rupee Inr Ramki
Share. Facebook Twitter Pinterest LinkedIn Tumblr Telegram Email
Previous ArticleElliott Wave Update for the Dow
Next Article Elliott Wave Analysis of Richemont
Ramki
  • Website

Related Posts

Trading NIFTY using Elliott Waves by Ramki of Wavetimes.com

October 23, 2013

Elliott Wave Analysis of USD/INR (Indian Rupee)

July 1, 2012

Stock market rally a chance to get out

June 11, 2012
View 24 Comments

24 Comments

  1. Manoj on September 18, 2011 6:13 am

    Sir Simple Question !!
    Can Elliot Waves Be Used In Agro Commodites Like CHANA–TUREMERIC Which Are Seasonal based ..Traded In NCDEX –If Yes Can Give A An Example on CHANA Ncdex !!

    Regards
    Manoj

    Reply
    • Ramki on September 18, 2011 10:53 am

      Manoj, EWP can be applied to any instrument that is traded widely.

      Reply
  2. Tulsidas Thakur on September 18, 2011 6:21 am

    Sir, I have bought your book two days back. Hope to learn labeling of waves by reading of book & your kind guidance.
    Thanks & Regards.
    ttthakur

    Reply
    • Ramki on September 18, 2011 10:54 am

      Tulsidas, Good luck with your learning experience. You can learn a lot by going through the archives in this blog after reading the book.

      Reply
  3. Yash on September 18, 2011 10:44 am

    This is great. Are you saying around 49 (62%) level is short term top or point from where it will turn down again. In other words do you think 52 level was all time high for long time? I see you have 52 to 39 as ABC means its corrective so now is this impulsive again that will go above 52?

    Reply
    • Ramki on September 18, 2011 10:56 am

      Yash, it is best to take this one step at a time. I am not saying anything more than what I have said on the comments.

      Reply
  4. K P Ganesh on September 18, 2011 11:09 am

    I’ve been tracking USD-INR price movements using weekly price data. Was waiting for completion of ending diagonal triangle near 44. This puts into perspective where Rupee is headed against dollar (as high as 60 to the dollar and even higher). Tells the story of what FII’s are about to do.

    Reply
  5. Sanjay Radia on September 19, 2011 1:31 pm

    Hi

    I have started understanding the principles in the book better after reading a couple of chapters few times and it’s an excellent foundation in the first 2 chapters…the issue I have with your book is why we didn’t have these pearls of your wisdom years ago 😉 Thank you for such an excellent book which is well worth it’s weight in gold (at current prices ;-). I’m no expert and thousands of leagues below yourself but thanks to your guidance when I look at a chart the first thing I inadvertently start doing is counting waves..unfotunately I also see the great missed trades from lack of this knowledge before…just got to build enough knowledge from further reading the book to apply it now.

    Reply
    • Ramki on September 19, 2011 8:00 pm

      Sanjay, I am glad you like the book. Good luck.

      Reply
  6. Hitesh on September 23, 2011 6:02 am

    Sir,

    I just come across the RBI guidelines about the forex trading, as per it, It’s prohibited !!! Would you please spread some lights on it.

    Thanks
    For your reference, I am attaching the link:

    http://www.rbi.org.in/scripts/BS_PressReleaseDisplay.aspx?prid=23941

    Reply
    • Ramki on September 23, 2011 6:19 am

      Hitesh, I have no idea about RBI regulations as I am not based in India. What I am trying to show here is how it is possible for hedgers to take action at key levels. Also, there is an active interbank market both in India and outside.

      Reply
    • BJ on September 25, 2011 3:14 am

      Hitesh,

      The answer is there in the link you have provided – “Residents are, however, permitted to trade in currency futures and options contracts, traded on the stock exchanges recognised by the Securities and Exchange Board of India (SEBI) in India..” The MCX provides this facility. If you are outside India this anyway does not pertain to you.

      Good luck,
      BJ

      Reply
  7. chamu on September 24, 2011 11:13 am

    Dear sir,

    can you please advice what levels the rupees will touch??will it go beyond 50 levels??

    thanks for your guidance sir.

    Reply
  8. LUCKY GULATI on October 1, 2011 9:40 pm

    Hi Ramki

    Having seen market touched ( nifty ) 4800 twice in a short span of time, and Dow in 10,000’s thousand, would like to know IS IT THAT WE ARE MISSING THE BIG PICTURE. I mean w.r.t nifty if i go about the charts are we heading for 61.8% retracement and touching 3800 ( starting from 2250 till 6300 ) ???

    Also Gold made a double top at 1925 lvls and now trading at 1620. Following the charts shown by you and some other experts can we hit 1480 ( tgt by you ) then down to 1330 and then all the way to 1130 any time soon ??? ( in anticipation and out of curiosity )

    Reply
    • Ramki on October 2, 2011 5:45 am

      Lucky G, If you go back to my earlier charts, 1155 was always there. We have to take these one step at a time, unless we are trying to make a living by making forecasts! (in which case one will be a hero one day, and an imbecile on another, depending on whether his/her follower has made money or not!)

      Reply
  9. Sunny on November 18, 2011 1:44 am

    Hi RK,

    Your last update was 2 months back. Do you think its time for another quick check as to where USDINR is heading now that is has zoomed past the 61.8 resistance and going with full vigour to break the all time high?

    thx
    Sunny

    Reply
    • Ramki on November 23, 2011 6:07 am

      Hi Koppishetty, Sorry for the dleayed response. But as I have indicated elsewhere, I am not waiting for the top myself. Convrting in stages is a sensble idea if one has a long term view. However, for traders it is a different story…..

      Reply
      • Sunny on November 23, 2011 2:02 pm

        Thankyou RK.

        I have asked a trader question and you responded to an investor :). Can’t ask for more!!

        Being an NRI(flashback:Long story short, lost a sizable amount converting USD to INR during 2007 anticipating rupee will appreciate further to 35 levels from 40s and was never able to balance in 2008 when it broke back to 50s) can’t go wrong this time around following an advice from a Sage. So its payback time folks 😉

        Reply
  10. Akshay on November 18, 2011 4:00 am

    Sir, the INR has depreciated with amazing ferocity and speed, characteristic of a 3rd Wave. However, unless the 1st Wave was an extended wave, odds are the third will extend, and the swiftness is sure indicative! At the very least, we should have equality between Wave One and Three, indicating a real stop only around 57? Could you please share your views? Much appreciated.

    – A very absorbed student from Chennai. 🙂

    Reply
    • Satya on November 22, 2011 10:53 pm

      I am new to Elliott analysis but quite keen to see how it works on USDINR.
      I just addeda new topic under EURUSD forum. (In Elliot wave forum menu option above). Could you please add you comments and analysis there. I hope may be some one will give their further analysis.
      Thank you,
      Satya

      Reply
  11. BJ on November 22, 2011 7:54 am

    Hi Ramki,

    The rupee has breezed through the all time low. So quite clearly it is a wave 3 of some degree. And the triple bottom at 44, seems to be a wave 2 that corrected the entire impulse move from 39 to 52 (there have been 2 small corrections during the move to 39 to 52) – like you have shown in your book. Could you please post an update on the counts here?
    Best regards,
    BJ

    Reply
    • Ramki on November 23, 2011 5:57 am

      BJ
      I will tell you what I am doing. I am converting some of my FC into INR in stages at various levels. So what does that tell you?

      Reply
  12. geeta on June 6, 2012 12:38 am

    Like they say, hindsight is always (more like, often) 100% right. Predicting money trends is as accurate as psychic readings – a make-believe way to make money.

    Reply
    • Ramki on June 6, 2012 6:16 am

      Hi Geeta, agree 100% with the first part of your comments. Thanks

      Reply

Leave A Reply Cancel Reply

Recent Posts
  • Has Meta (Facebook) stock seen the bottom
  • What Is The Nearest Technical Support For Meta (NASDAQ: FB)
  • Using Elliott Waves to Capture a Trade in S&P500
  • Hedge Funds and Elliott Waves – Netflix $NFLX
  • When Elliott Waves applauds the promoter’s signals!

WaveTimes is a Research Organization dedicated to providing original analysis, reports, reviews, and insights on developments in mutual funds, stocks, investing, foreign exchange, commodities, and bonds.

Contact WaveTimes

L-601 Mantri Espana,

Kariyammana Agrahara, Bellandur, Bangalore 560103

Follow Us

  • Facebook
  • YouTube
  • Twitter

© 2022 Wave Times. All Rights Reserved.
  • About
  • Books
  • Privacy Policy
  • Policies and Standards

Type above and press Enter to search. Press Esc to cancel.