The writeup that follows will use Elliot Wave analysis of USDCAD to arrive at some strategic conclusions. But first, a brief background. Most leading players are currently neutral in their outlook for the USDCAD. The Bank of Canada has made it clear that it is willing to act should recent strong data turn out to be temporary.They are also concerned about the downside risks to the outlook from a stronger CAD.In this environment, the CAD has weakened recently.Our goal is to use Elliott Wave analysis to determine the direction and scale of the upcoming moves.
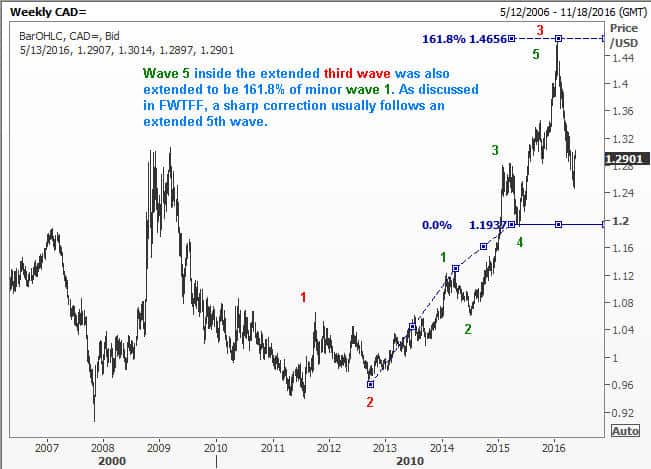
Four Elliott Wave charts of USDCAD are presented. The first chart shows the big picture. It is a weekly chart. We start with the significant low of July 2009 at 0.9403 and see that maybe an extended wave 3 was posted at 1.4656 in January 2016. We look at the sub waves inside the extended that third wave and infer that maybe we are on the right path.
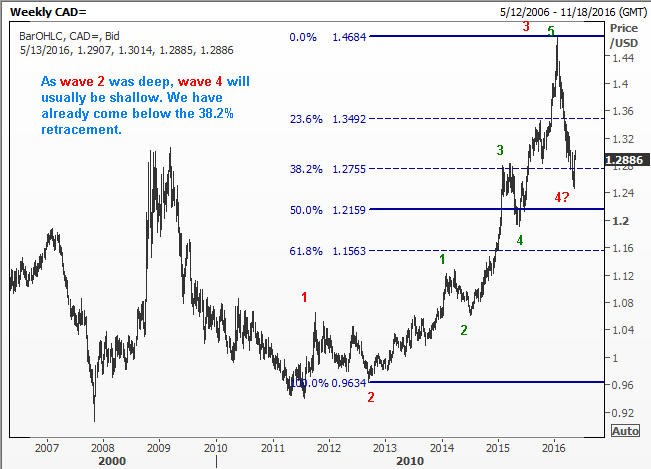
In the next Elliott Wave chart, we reason out that as wave 2 was deep, wave 4 is likely to be brief and short.
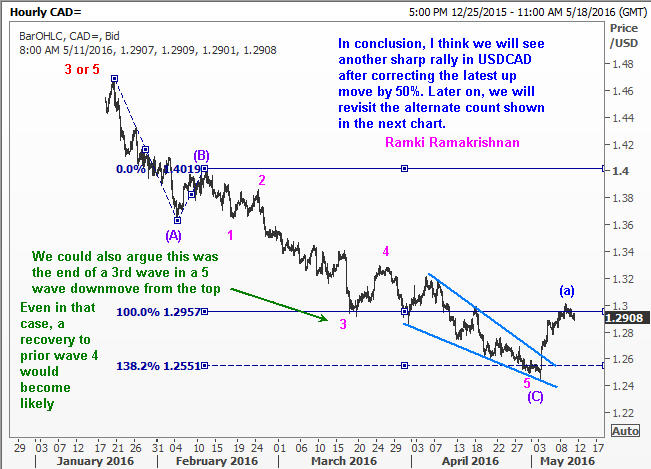
We will now look at the supposed wave 4 in detail. It looks like wave C within wave 4 has ended with a minor diagonal triangle at the fifth wave position in wave C. So a recovery back to the top of the diagonal triangle (also prior wave 4 level) seems likely. But we can’t jump in and buy right away. That will be suicidal. It might be a better idea to wait for a decent pull back, say by 50%, of the latest rally and start building a long USDCAD position in stages. Immediate strong resistance lies around 1.3250 levels.
A sensible trader will always consider what could go wrong with his analysis. We do that next in this Elliott Wave analysis of USDCAD.
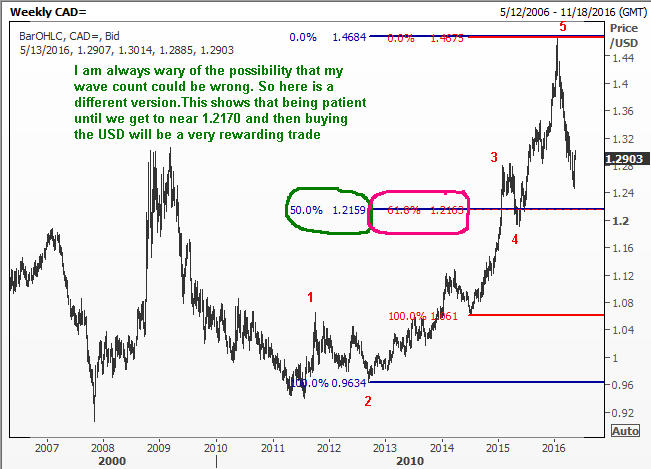
While we have this alternate count in place, I am still considering a move to at least the prior wave 4 is likely. Later on, if we get a fresh round of selling, and see the USDCAD back down near 1.2170, then we will be happy to buy again there.
There are many other examples of using Elliott Waves in this blog. I am sure you will find them interesting. Enjoy!
