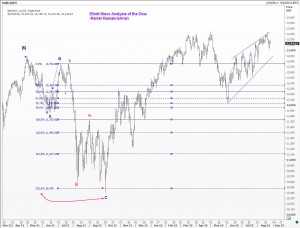
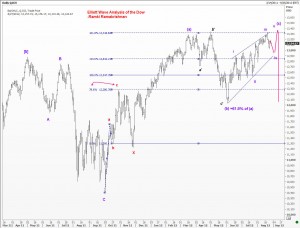
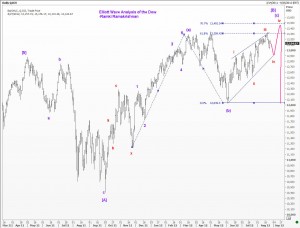
After my recent posts on the S&P500 provoked some animated discussions, I was persuaded by one reader to look at the Dow. What follows below are three charts that offer my Elliott Wave Analysis of the Dow Jones Industrial Average.
Elliott Wave Rules and Guidelines continue to be observed here. However, I must confess that I am trying to squeeze in a count to fit my view. This is not an entirely recommended approach to using the wave analysis. However,because I am not able to honestly call the current recovery from the June low of 12035 as impulsive, the wave counts that I offer you on the Dow here is my best effort. We shall know soon enough. Good luck folks.
17 Comments
If time permits you, please share your EW count of Nifty and Sensex.
Hi Mehul, will try….
Hi Ramki,
I’m a little confused by your current count of the Dow. On the 3rd chart it appears that you are depicting a w-x-y move for (a), but y must subdivide into a 3 wave move and cannot be a standalone 5 wave move, under the current rules of EW. Could you elaborate a little please.
Thanks,
Jason
HI Jason, I havent used the letter ‘w’ anywhere. The irregular [B] wave that is nearing completion is a double zigzag , ie 2 sets of abc with an x wave in the middle. The second abc starts off with a 5 wave pattern for wave (a) and the (c) wave is (hopefully) going to be a diagonal trinagle
Very important, with this count, and considering the final triangle wave 3 is shorter then wave 1, so when wave 4 finishes we can know exactly where wave 5 should finish.
Hi David, yes indeed! You clearly know you Elliott. But let’s wait for this current move to finish, and then for the C wave. Cheers
Hi Ramki, in the last chart above in the END.DIAG. Pattern of the wave (c) of [B] wave iv down is again followed by wave iv up.at 70.7 Projection. If I am not mistaken it should be wave v at the top. Please correct me if I am wrong.
Today REL .COM closed at 50.95 inching towards 44.
Thanks and Regards.
Dr Sanjay , yes that is wave v! You have very sharp eyes….
Thanks Ramki. I want to make my trading also sharp under your able guidance. Good Day.
Hello Ramki Sir
I have been a follower of this column for many months now,I have observed very few “Buying” opportunities(or as you say low Risk entry points) being identified compared to the “Selling” points You identify(after so many Selling Points in different Stocks and Indices, I saw RCom as a “low Risk Buy @ 44” few weeks back).Does this say something about the EW ??
Regards
Jagmohan
Hi Jagmohhan, nice observation..its just that i haven’t gone looking for those candidates that were low risk buys. EWP works just equally well on both sides.
Dear Sir,
You always go Horribly “Right” and m sure most of the people are talking rubbish but the time will tell as always. Thanks for the book you published for a small traders like us and i have been doing quite good in intraday as well
Thanks a tonne !!
Regards
Devidas Rajadhikary
Dear Ramki,
Dow and S&P also breaking triangle, so now wt is the next target for that.
Muy señor mío Ramki:
I would like to have a better english level, but …….I tried to explain my previous question in a better way.
In the same diagonal could have two corrective formation a leading one and and ending?
One of de main reason I like your book it’s for de direct language you use to write. And you can discover it is not one of my virtues.
Thankyou
Señor Jesus, thank you for writing. Language is only a means of communication. Even for me, English is not my native language. I think your question is whether we can see two diagonal triangles in a complex correction where wave A is a leading diagonal and wave C is an ending diagonal. Theoretically it should be possible, because complex corrections could take any forms they like. But to get two diagonals in one correction is unusual and I don’t remember to have seen it recently. While I congratulate you on seeking to learn the possibilities, you should also focus on learning how you can trade the markets using EWP. One secret is to generally avoid trading anything that looks like a complex correction. If wave 2 was simple, avoid wave 4, but if wave 2 was complex, you might try a small counter trend trade in wave 4. Good luck.
Hi Mr R
Where are we in the BIG picture! The Elliott wave book states we are about to finish the Millenium wave (and subsequently will have 3 Grand Super Cycles as a correction P124 line 11)and another web site “Escaping OZ” states that Robert Prechter has said that Grand Super cycle 3 started in 1784 and ended in the year 2000?!! And then the author goes on to say that the Millenium wave is now finished and that the Grand Super Cycle has finished 5 waves. Are we in wave 4 of GSC 5 or are we now finished?
Any thoughts on this or how it will unfold? I know it is grossly academic, but nevertheless quite interesting.
HI Trevor, Thank you for pointing out that such discussions are mostly academic in nature. May I recommend that you spend more time in understanding how to use EWP to become a more profitable trader? Honestly, one doesn’t need to become an expert in order to transform his trading results. Focus on determining terminal points of current, tradable waves. Leave the discussions to those who have lots of time in their hands. I am not casting them in bad light. It is just a preference that I express, and I invite readers of WaveTimes to embrace this alternate approach to the markets.