• About
  • Elliott Waves
    • Elliott Waves Explained
    • Elliott Wave Magic Illustrated with Wave Charts
    • Elliott Wave Edge – How Elliott Wave Traders Win
    • Fibonacci Number Series and Elliott Waves
    • How to use Fibonacci Ratio Retracements
    • Elliott Wave Books
      • The Elliott Wave Book – Five Waves to Financial Freedom
      • Dividend Growth Investing Using Elliott Waves
    • Videos
  • Equities
    • Indices
      • Africa
        • Egypt
      • Australia
      • European Indices
        • AEX – Index, Amsterdam
        • DAX Index
        • Istanbul
        • Russia
        • Spain’s IBEX 35
      • Asian Indices
        • India
        • China
        • Dubai
        • Kuwait
        • Kuala Lumpur
        • Pakistan
        • Saudi
        • Taiwan
      • US Indices
        • S&P500
        • Nasdaq
        • Dow Jones
        • Dow Jones Utilities
    • Stocks
      • Asian Stocks
        • Indian Stocks Trading
        • Dubai Stocks Outlook
        • Japanese Stocks
        • Kuwait stocks
        • Saudi Stocks Outlook
      • African Stocks
        • Egyptian Stocks
      • Swiss Stocks
      • Australian Stocks
      • European Stocks
      • US Stocks outlook
      • UK Stocks
  • Commodities
    • Copper
    • Gasoline
    • Gold
    • Natural Gas
    • Oil
    • Palm Oil
    • Raw Sugar
    • Rubber
    • Soybean Oil
    • Silver
  • Forex
    • AUD
    • Bitcoin
    • CAD
    • CHF
    • Euro
    • GBP
    • INR
    • NZD
    • JPY
  • Raves
  • Consulting
    • Consulting
  • Ramki’s Watchlist
Top News

Has Meta (Facebook) stock seen the bottom

March 21, 2022

What Is The Nearest Technical Support For Meta (NASDAQ: FB)

February 7, 2022

Using Elliott Waves to Capture a Trade in S&P500

January 27, 2022
Facebook Twitter Instagram
WaveTimes Blog WaveTimes Blog
Wave times
  • About
  • Elliott Waves
    • Elliott Waves Explained
    • Elliott Wave Magic Illustrated with Wave Charts
    • Elliott Wave Edge – How Elliott Wave Traders Win
    • Fibonacci Number Series and Elliott Waves
    • How to use Fibonacci Ratio Retracements
    • Elliott Wave Books
      • The Elliott Wave Book – Five Waves to Financial Freedom
      • Dividend Growth Investing Using Elliott Waves
    • Videos
  • Equities
    • Indices
      • Africa
        • Egypt
      • Australia
      • European Indices
        • AEX – Index, Amsterdam
        • DAX Index
        • Istanbul
        • Russia
        • Spain’s IBEX 35
      • Asian Indices
        • India
        • China
        • Dubai
        • Kuwait
        • Kuala Lumpur
        • Pakistan
        • Saudi
        • Taiwan
      • US Indices
        • S&P500
        • Nasdaq
        • Dow Jones
        • Dow Jones Utilities
    • Stocks
      • Asian Stocks
        • Indian Stocks Trading
        • Dubai Stocks Outlook
        • Japanese Stocks
        • Kuwait stocks
        • Saudi Stocks Outlook
      • African Stocks
        • Egyptian Stocks
      • Swiss Stocks
      • Australian Stocks
      • European Stocks
      • US Stocks outlook
      • UK Stocks
  • Commodities
    • Copper
    • Gasoline
    • Gold
    • Natural Gas
    • Oil
    • Palm Oil
    • Raw Sugar
    • Rubber
    • Soybean Oil
    • Silver
  • Forex
    • AUD
    • Bitcoin
    • CAD
    • CHF
    • Euro
    • GBP
    • INR
    • NZD
    • JPY
  • Raves
  • Consulting
    • Consulting
  • Ramki’s Watchlist
WaveTimes Blog WaveTimes Blog
Home » Elliott Wave Analysis of the AEX-Index, Amsterdam Exchange
AEX - Index, Amsterdam

Elliott Wave Analysis of the AEX-Index, Amsterdam Exchange

RamkiBy RamkiMarch 26, 201215 Comments2 Mins Read
Facebook Twitter LinkedIn Telegram Pinterest Tumblr Reddit WhatsApp Email
Share
Facebook Twitter LinkedIn Pinterest Email

As part of your Elliott Wave education, WaveTimes brings you the analysis of the AEX Index, which is a free-floated adjusted market capitalization weighted index of the leading Dutch (Netherland) stocks on the Amsterdam Exchange.

As always, there are notes directly on the chart itself. Elliott Wave analysis is always a work in progress. You should not ever think that once you do your wave counts, you can forget about it and the markets have to obey your diktat! Quite the opposite, really! The market is the master, and we make adjustments along the way. However, the real value of Elliott Waves come into play when you know before hand that there is a chance to reach 356, and that if the index starts coming off from there, we should be watchful near the top of wave (a) because a move below that top will violate one of the rules of Elliott Wave Principle. If that happens, we will cease to buy dips because we will then be back in a bear mode…and so on and so forth.
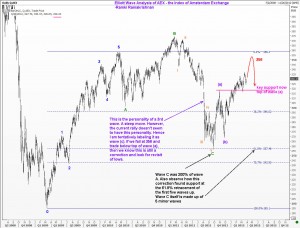
AEX Index Amsterdam Exchange
Of course, Elliott Waves will appear daunting to the uninitiated, but I hope the book “Five Waves to Financial Freedom” has helped make it easy for you to learn enough of Elliott Waves so that you can start applying what you have learned quite quickly. Good luck, ye punters.

Share. Facebook Twitter Pinterest LinkedIn Tumblr Telegram Email
Previous ArticleWhy do we make trading so hard for ourselves?
Next Article Special Update : Reminder
Ramki
  • Website

View 15 Comments

15 Comments

  1. Mark on March 27, 2012 8:34 am

    Thanks for posting your views . So, overall 360 means a strong resistance level…

    Reply
  2. Mark on May 9, 2012 4:37 am

    Hi Ramki,

    With a current market scenario , do you have any fresh views on AEX Index Pattern ? Would appreciate if you can post your current views on AEX . Thanks in advance for your opinion and views.

    Reply
    • Ramki on May 9, 2012 4:51 am

      Hi Mark, As we clearly have an overlap of wave A at 318, the markets have turned bearish. However, the first leg down from the top at 337 (it never made it to 356) is unfolding in 5 tiny waves, and we seem to be in wave 5. So don’t get overly bearish near supports between 280 and 288 as we need to correct that first 5wave move down.If that correction is slow, then we should sell aggressively as it turns down again

      Reply
  3. Mark on June 13, 2012 1:36 pm

    Hi Ramki,

    Hope you had a nice vacation . Was wondering what is your new view on AEX index in a current market situation . Request you to post your comments.

    Reply
    • Ramki on June 14, 2012 3:21 am

      Mark, re the AEX, while we stay below 308, we stay bearish

      Reply
  4. Antonio on June 14, 2012 10:26 pm

    Hi Ramki, welcome back, I hope you have spent beautiful days in the mediterranean!
    I think after the A-B-C correction in this chart to around 252, I´d have labeled 1, 2 instead (a), (b), and surely make a mistake. Why did you do it like that, and why to 356
    Thank you very much for your time and help!

    Reply
    • Ramki on June 18, 2012 3:16 am

      Antonio, If you go back and read my book, you can figure it out yourself! Good luck

      Reply
  5. Mark on July 8, 2012 6:03 am

    Hi Ramki ,

    Sine AEX is now above 308 , so I guess now the index seems to be bullish and targeting 330 -340. Do you think the same ? Awaiting your latest views on AEX . Thanks in advance.

    Reply
    • Ramki Ramakrishnan on July 8, 2012 9:53 pm

      Mark, Although it is not moving down quickly just yet, in the bigger picture I am bearish for the AEX. The main reason is (as explained in my book) the movement from the Sep 25, 2011 low of 256 looks to be a 3-wave recovery. We then had an overlap. The best you could hope for is another recovery as a second zigzag. But if it trades below 304 now that will be yet another overlap…on balance, stay away from this market until a clear Elliott Wave pattern is established. It is so easy to lose money during a complex correction

      Reply
      • Mark on July 8, 2012 10:56 pm

        Thanks Ramki for your views and guidance. I would try to resist myself from the market -trading….:)

        Reply
  6. Mark on August 7, 2012 7:33 am

    Hello Ramki ,

    Do you have any new formed opinion on AEX given the fact that most of the world stock indices are bullish inspite of negative news around the world ?

    Thanks in advance

    Reply
    • Ramki Ramakrishnan on August 8, 2012 12:33 am

      Hi Mark, the dip from 337 to 281 in the AEX overlapped the top of wave A confirming that the whole move is a corrective pattern (i.e. this is not an impulse wave setting off a new uptrend). The subsequent recovery should also be viewed as such, ie part of a complex correction. It is true that this index, along with several others in teh world, is going up, and whether we call it correction or impulse it doesn’t matter much unless we have a proper trade recommendation. As you know, I am not in favor of arm chaor analysis, ie analysis for the sake of showing off that we can count waves. We need to be able to translate our analysis into solid views for a trade. When that is possible, I try to make a bold recommendation. When that is not possible, I usually stay away. In any case, for the AEX, we should forget the bigger picture for now. Let us start counting from the recent low of 281 seen on 1st June, and see if we can figure out a 5 wave pattern. I think a 3rd wave (being 200% of 1st wave) finished at 323. BUt the ensuing recovery is also strong. SO maybe we are still in an extended 3rd wave.I wouldnt want to be prematurely short of this index. Allow the index to run its course; it will signal us that the move is over at a future date, and if you have read FWTFF, you too can spot teh signals quite easily. Good luck

      Reply
  7. Mark on April 27, 2013 11:08 am

    Hello Ramki ,

    Can you share and post your new formed opinion on AEX stock indice in a current situation around the world ?

    Thanks in advance

    Reply
  8. Mark on May 3, 2013 10:19 pm

    Hi Ramki,

    Waiting anxiously for your fresh opinion on AEX Index ? Hope you will try to post soon….:)

    Reply
    • Ramki Ramakrishnan on May 7, 2013 8:57 pm

      Mark, I expect some resistance at 368.80 in the AEX index

      Reply

Leave A Reply Cancel Reply

Recent Posts
  • Has Meta (Facebook) stock seen the bottom
  • What Is The Nearest Technical Support For Meta (NASDAQ: FB)
  • Using Elliott Waves to Capture a Trade in S&P500
  • Hedge Funds and Elliott Waves – Netflix $NFLX
  • When Elliott Waves applauds the promoter’s signals!

WaveTimes is a Research Organization dedicated to providing original analysis, reports, reviews, and insights on developments in mutual funds, stocks, investing, foreign exchange, commodities, and bonds.

Contact WaveTimes

L-601 Mantri Espana,

Kariyammana Agrahara, Bellandur, Bangalore 560103

Follow Us

  • Facebook
  • YouTube
  • Twitter

© 2023 Wave Times. All Rights Reserved.
  • About
  • Books
  • Privacy Policy
  • Policies and Standards

Type above and press Enter to search. Press Esc to cancel.