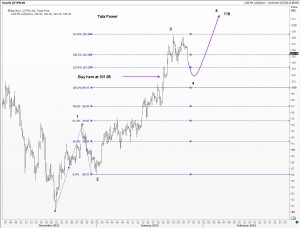
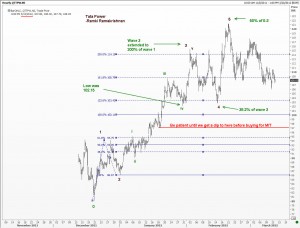
Back in January I had done some Elliott Wave analysis of Tata Power (TATAPOWER.NS) for my own use, and had planned to buy the stock on a dip to 101.65. See the first chart. The actual low came in at 102.15 and the stock rallied.

Today I revisited my watc list and figured out what happened.
Take a look at the second chart. If I was watching the Indian market every day, then I would have revised my counts as shown here, and captured the entire fifth wave. So clearly, if you learn my techniques, you too could profit from Elliott Wave analysis. Tata Power is just one of the stocks. 
Elliott Wave Analysis of Tata Power

Unleash your Potential
Transform your trading – Starting Today
