• About
  • Elliott Waves
    • Elliott Waves Explained
    • Elliott Wave Magic Illustrated with Wave Charts
    • Elliott Wave Edge – How Elliott Wave Traders Win
    • Fibonacci Number Series and Elliott Waves
    • How to use Fibonacci Ratio Retracements
    • Elliott Wave Books
      • The Elliott Wave Book – Five Waves to Financial Freedom
      • Dividend Growth Investing Using Elliott Waves
    • Videos
  • Equities
    • Indices
      • Africa
        • Egypt
      • Australia
      • European Indices
        • AEX – Index, Amsterdam
        • DAX Index
        • Istanbul
        • Russia
        • Spain’s IBEX 35
      • Asian Indices
        • India
        • China
        • Dubai
        • Kuwait
        • Kuala Lumpur
        • Pakistan
        • Saudi
        • Taiwan
      • US Indices
        • S&P500
        • Nasdaq
        • Dow Jones
        • Dow Jones Utilities
    • Stocks
      • Asian Stocks
        • Indian Stocks Trading
        • Dubai Stocks Outlook
        • Japanese Stocks
        • Kuwait stocks
        • Saudi Stocks Outlook
      • African Stocks
        • Egyptian Stocks
      • Swiss Stocks
      • Australian Stocks
      • European Stocks
      • US Stocks outlook
      • UK Stocks
  • Commodities
    • Copper
    • Gasoline
    • Gold
    • Natural Gas
    • Oil
    • Palm Oil
    • Raw Sugar
    • Rubber
    • Soybean Oil
    • Silver
  • Forex
    • AUD
    • Bitcoin
    • CAD
    • CHF
    • Euro
    • GBP
    • INR
    • NZD
    • JPY
  • Raves
  • Consulting
    • Consulting
  • Ramki’s Watchlist
Top News

Has Meta (Facebook) stock seen the bottom

March 21, 2022

What Is The Nearest Technical Support For Meta (NASDAQ: FB)

February 7, 2022

Using Elliott Waves to Capture a Trade in S&P500

January 27, 2022
Facebook Twitter Instagram
WaveTimes Blog WaveTimes Blog
Wave times
  • About
  • Elliott Waves
    • Elliott Waves Explained
    • Elliott Wave Magic Illustrated with Wave Charts
    • Elliott Wave Edge – How Elliott Wave Traders Win
    • Fibonacci Number Series and Elliott Waves
    • How to use Fibonacci Ratio Retracements
    • Elliott Wave Books
      • The Elliott Wave Book – Five Waves to Financial Freedom
      • Dividend Growth Investing Using Elliott Waves
    • Videos
  • Equities
    • Indices
      • Africa
        • Egypt
      • Australia
      • European Indices
        • AEX – Index, Amsterdam
        • DAX Index
        • Istanbul
        • Russia
        • Spain’s IBEX 35
      • Asian Indices
        • India
        • China
        • Dubai
        • Kuwait
        • Kuala Lumpur
        • Pakistan
        • Saudi
        • Taiwan
      • US Indices
        • S&P500
        • Nasdaq
        • Dow Jones
        • Dow Jones Utilities
    • Stocks
      • Asian Stocks
        • Indian Stocks Trading
        • Dubai Stocks Outlook
        • Japanese Stocks
        • Kuwait stocks
        • Saudi Stocks Outlook
      • African Stocks
        • Egyptian Stocks
      • Swiss Stocks
      • Australian Stocks
      • European Stocks
      • US Stocks outlook
      • UK Stocks
  • Commodities
    • Copper
    • Gasoline
    • Gold
    • Natural Gas
    • Oil
    • Palm Oil
    • Raw Sugar
    • Rubber
    • Soybean Oil
    • Silver
  • Forex
    • AUD
    • Bitcoin
    • CAD
    • CHF
    • Euro
    • GBP
    • INR
    • NZD
    • JPY
  • Raves
  • Consulting
    • Consulting
  • Ramki’s Watchlist
WaveTimes Blog WaveTimes Blog
Home » Elliott Wave Analysis of Taiwan's TAIEX Index (TWSE)
Taiwan

Elliott Wave Analysis of Taiwan's TAIEX Index (TWSE)

RamkiBy RamkiJune 27, 201213 Comments3 Mins Read
Facebook Twitter LinkedIn Telegram Pinterest Tumblr Reddit WhatsApp Email
Share
Facebook Twitter LinkedIn Pinterest Email

A few days back I received an email from a reader in Taiwan that he had first heard of me from a Chinese website that had translated my Elliott Wave analysis of SSE. Would it be possible to do a similar Elliott Wave analysis of Taiwan’s TAIEX index? Of course! So I spent some time studying this chart, and here are my thoughts on the TWSE index.

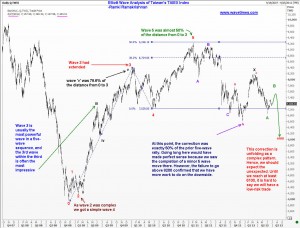
It is relatively easy to spot a clear five-wave pattern from the low of 3955 (seen in Nov 2008) to the high of 9220 (Feb 2011). As you know, the five waves will contain three impulses in it, and each impulse wave would have its own five sub-waves. I have marked out the sub-waves of the third wave for you in the chart. You can also observe that several other Elliott Wave characteristics are present in the movements. For example, the third wave is the longest wave (being an extended wave). The all-powerful “3rd of the third” is also marked out for you.
Elliott Wave Analysis of TAIWAN stock index

You would remember from my book “Five Waves to Financial Freedom” the principle of alternation. This says that two successive corrections are likely to be different in terms of the time it takes to ufold, in terms of the distance they travel and also in terms of complexity. When the 2nd wave is complex, as is the case here, the fourth wave tends to be a simple correction. The waves all tend to be related to each other by some Fibonacci ratio. For example, the fifth wave travelled a distance of 50% of the measure from point 0 to point 3. You will also notice that the fifth minor wave inside the extended third wave was also 78.6% of the distance covered by waves i through iii.

That was all fine. So what about the future? After we got a decent move down to the 50% retracement level, the index started climbing. If that recovery was a third wave, we should not have got the down move from near 8200. The extent of that sell-off sort of signals to me that we still need to do some work on the downside before chance of any big rally. Unfortunately, the patterns that I see are clearly indicative of another complex correction, and I am always cautious when dealing with these monsters. They can rob us of money very quickly. So while I am looking for a chance to test 6100, I would urge traders and investors to be mindful of sudden twists and turns that would cause needless tensions. Better to be patient for that down move to at least 6100 before doing anything. I hope one of you will remind me when we reach there in the future (or if we go straight to the moon!!) because there are just too many events happening at the same time for me to keep track of. I wish you readers in Taiwan and China the very best of luck and welcome you to the magical world of Elliott Waves and WaveTimes.

taiwan index twse
Share. Facebook Twitter Pinterest LinkedIn Tumblr Telegram Email
Previous ArticlePrepare for a further 25% loss in Glencore PLC share value
Next Article Crude Oil & Brent Crude Outlook: Can I get more wrong than this?
Ramki
  • Website

View 13 Comments

13 Comments

  1. Jim (Wolfhound on Twitter) on June 27, 2012 7:19 am

    Hi Ramki

    Enjoy your work as always. Just a question on your comment on the chart of the Taiwan exchange that the 50% retrace as a good point to get long as we just had a minor 5 wave move complete.

    If this is a b wave of an expanded flat X wave (as per your chart labels) should this not be a three wave move? Looks to me like the whole move down from the top was a 5 wave affair (three motive waves being your A,C and b waves) which then makes perfect sense with a minor 5 wave to form (v) of A/1.

    Reply
    • Ramki on June 27, 2012 8:00 am

      Hi Jim, your understanding is perfect. I am NOW able to call it an expanded flat. At the time it developed, it would have appeared as a five wave A completed at the point I have marked as “b”. So it would have made sense to buy there for a corrective zigzag bounce at least, if not a possible 3rd wave in the event I had made an error in counting. The point I was trying to make is one is able to trade the market is real time..

      Reply
  2. Kirill on June 27, 2012 7:31 am

    If Head n Shoulders formation unfolds, the next target is around 4,000 )))

    Reply
    • Ramki on June 27, 2012 8:06 am

      Hello Kirill, in my upcoming book, I have explained about why you should avoid looking for head and shoulders formations

      Reply
  3. Vincent Mei on June 27, 2012 8:21 am

    Hi Ramki:
    Thanks to share your view to TAIEX. As one of your reader in Taiwan, it is really good to have your opinion on TAIEX. Few questions would like to have your comments.
    1. From 9220 to 6609, you mark it as A-B-C plus a-b in X. Why isn’t it a 5 waves as A, and c in X as B, then followed by a to-be-finished 5 wave as C? That completes a complex A-B-C correction if in this scenario. Any criteria in your wave count?
    2. Follow your wave count. The wave after X will be a 3 wave pattern? Any timeline suggestion to 6100? Is it correlated to S&P 500 downside to 1100?

    By the way, is your book only on kindle version? Any other format or source for iPad?
    Thanks again for all your sharing on EW.

    Reply
    • Ramki on June 27, 2012 7:52 pm

      Hi Vincent, thanks for your comments. (a) wave b should be made of 3 waves and wave c should always be 5 waves. It is clear that the wave that completed X was a 5 wave move. The only way we can count that is as a C wave. This is explained in detail in my book. (b) kindle books are not available everywhere. Some Internet sites are suggesting you cn open a US based Amazon acct b giving th address of pizza hut! Because all delivery is wireless anyway. However, there is another solution. Click on the image of my book on wavetimes and read the instructions on the page that shows up. There is a vendor called Infibeam who serves your country I think. Let me know once you succeed. Good luck

      Reply
      • Vincent Mei on June 27, 2012 9:46 pm

        Hi Ramki,

        Got it from kindle for iPad. Will read it now and thanks.

        Reply
        • Ramki on June 28, 2012 3:08 am

          Hi Vincent, Welcome to the Club!

          Reply
  4. Jim (Wolfhound on Twitter) on June 28, 2012 12:43 am

    Hi again

    I understand what you are saying but shouldn’t the “b” of the expanded flat X wave be a three……and not “a minor 5 wave move”?

    Thanks.

    Jim

    Reply
    • Ramki on June 28, 2012 3:21 am

      Jim, That is a brilliant question. I am now able to see your observation. For the time being, we will have to allow the X wave to be the movement from 6609 to 8170. Otherwise, it becomes hard to explain how we have 3 sets of 5-wave movements one after the other, as that is not allowed by EWP. Congratulations on being such a diligent student! I am sure that we will have to revist this chart soon again.

      Reply
      • Vincent Mei on June 28, 2012 7:37 am

        Hi Ramki,
        I have similar question like Jim’s. If 9920 to 6609 is a complete 5 waves of higher level, and X is just between 6609 to 8170. Assumption for this scenario is a and b in your labels are separately minor 3 waves and 5 waves. However whether X is a 5 waves or 3 waves will make future bit different. Is the 6609 to 8170 5 waves or 3 waves?

        Reply
        • Ramki on June 28, 2012 8:40 am

          Hi Vincent, I am not sure your levels are accurate, but let me just answer your last question. x waves separate two sets of corrective patterns. There is no preset formation for X waves, and they can take a variety of shapes. For the time being, I have conveniently called that rally as X wave because it suits my overall count. I will surely proved wrong at some time. But between now and that time, I seek to get a sense of direction. I propose that we will see the index trade lower, but that could come after a brief recovery as shown in the chart.

          Reply
  5. Jun on November 11, 2015 11:26 am

    Dear Ramki Sir, did we complete up move from 15748 today at 19612? 18255 to 19612 is 1357 which is apprx 1.382 of 15748 to 19137.sub wave 5 ended at 19612 at today’s high?or did we complete up move from 16598 today at 19612? sub wave 1 : 15748 to 17631 ( 1883 )sub wave 2 : 17631 to 16598 ( 1033 )sub wave 3 : 16598 to 19612 (3014 ) which is 1.618 of sub wave 1.to be followed by sub wave 4 down and sub wave 5 up to complete upmove which has started at 15135? Regards,Pankaj Shah

    Reply

Leave A Reply Cancel Reply

Recent Posts
  • Has Meta (Facebook) stock seen the bottom
  • What Is The Nearest Technical Support For Meta (NASDAQ: FB)
  • Using Elliott Waves to Capture a Trade in S&P500
  • Hedge Funds and Elliott Waves – Netflix $NFLX
  • When Elliott Waves applauds the promoter’s signals!

WaveTimes is a Research Organization dedicated to providing original analysis, reports, reviews, and insights on developments in mutual funds, stocks, investing, foreign exchange, commodities, and bonds.

Contact WaveTimes

L-601 Mantri Espana,

Kariyammana Agrahara, Bellandur, Bangalore 560103

Follow Us

  • Facebook
  • YouTube
  • Twitter

© 2023 Wave Times. All Rights Reserved.
  • About
  • Books
  • Privacy Policy
  • Policies and Standards

Type above and press Enter to search. Press Esc to cancel.